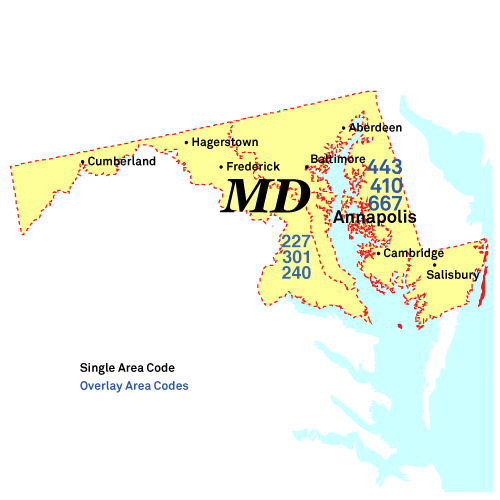
Stevensville Phone Book
Public Schools
Alternative Fuel Stations
Fire Departments
United Communities Volunteer Fire Department (Queen Anne'S County Station 9)
9406 Romancoke Rd, Stevensville, MD 21666
Stevensville Reverse Phone Lookup
Browse Chicago phone numbers by rate center and prefix.
Stevensville Phone Numbers
Rate Center: Stevensville (STEVENSVL)
Phone numbers with the Stevensville rate center prefixes:
Illinois City Phone Books
- Baltimore, MD Phone Book
- Columbia, MD Phone Book
- Germantown, MD Phone Book
- Silver Spring, MD Phone Book
- Waldorf, MD Phone Book
- Ellicott City, MD Phone Book
- Frederick, MD Phone Book
- Glen Burnie, MD Phone Book
- Rockville, MD Phone Book
- Gaithersburg, MD Phone Book
- Bethesda, MD Phone Book
- Bowie, MD Phone Book
- Towson, MD Phone Book
- Wheaton, MD Phone Book
- North Bethesda, MD Phone Book
- Potomac, MD Phone Book
- Odenton, MD Phone Book
- Catonsville, MD Phone Book
- Hagerstown, MD Phone Book
- Annapolis, MD Phone Book
- Clinton, MD Phone Book
- Randallstown, MD Phone Book
- Owings Mills, MD Phone Book
- Salisbury, MD Phone Book
- College Park, MD Phone Book
- Pasadena, MD Phone Book
- Reisterstown, MD Phone Book
- Clarksburg, MD Phone Book
- Laurel, MD Phone Book
- Suitland, MD Phone Book
- Edgewood, MD Phone Book
- Fort Washington, MD Phone Book
- Arnold, MD Phone Book
- Greenbelt, MD Phone Book
- Landover, MD Phone Book
- Cockeysville, MD Phone Book
- Elkridge, MD Phone Book
- Cumberland, MD Phone Book
- Westminster, MD Phone Book
- Hyattsville, MD Phone Book
- Oxon Hill, MD Phone Book
- Beltsville, MD Phone Book
- Takoma Park, MD Phone Book
- Easton, MD Phone Book
- Aberdeen, MD Phone Book
- Elkton, MD Phone Book
- California, MD Phone Book
- Havre de Grace, MD Phone Book
- Lexington Park, MD Phone Book
- Cambridge, MD Phone Book
- Largo, MD Phone Book
- Lanham, MD Phone Book
- Timonium, MD Phone Book
- Jessup, MD Phone Book
- Linthicum, MD Phone Book
- Bel Air, MD Phone Book
- Chevy Chase, MD Phone Book
- La Plata, MD Phone Book
- White Marsh, MD Phone Book
- Brandywine, MD Phone Book
- Edgewater, MD Phone Book
- Frostburg, MD Phone Book
- Temple Hills, MD Phone Book
- Stevensville, MD Phone Book
- Ocean City, MD Phone Book
- Thurmont, MD Phone Book
- Abingdon, MD Phone Book
- Chestertown, MD Phone Book
- Centreville, MD Phone Book
- Berlin, MD Phone Book
- Capitol Heights, MD Phone Book
- Denton, MD Phone Book
- Fulton, MD Phone Book
- Sykesville, MD Phone Book
- Indian Head, MD Phone Book
- Leonardtown, MD Phone Book
- North East, MD Phone Book
- Grasonville, MD Phone Book
- Princess Anne, MD Phone Book
- Chevy Chase, MD Phone Book
- Prince Frederick, MD Phone Book
- Federalsburg, MD Phone Book
- Solomons, MD Phone Book
- Kensington, MD Phone Book
- Snow Hill, MD Phone Book
- Oakland, MD Phone Book
- Hancock, MD Phone Book
- Bel Air, MD Phone Book
- St. Michaels, MD Phone Book
- Grantsville, MD Phone Book
- Upper Marlboro, MD Phone Book
- Nottingham, MD Phone Book
- Linthicum Heights, MD Phone Book
- Clarksville, MD Phone Book
- Ijamsville, MD Phone Book
- Annapolis Junction, MD Phone Book
- Hanover, MD Phone Book
Local Time in Stevensville, MD
Local Time
03:20 AM
Date
Wednesday, April 30, 2025
Time Zone
EDT
Stevensville, MD Population
Chicago has a population of 8145 people. Sex ratio is 97.50 males per 100 females.
Population by Age
The median age in Chicago is 34.8 years.
| Age Groups | Population |
|---|---|
| Under 5 years | 329 |
| 5 to 9 years | 530 |
| 10 to 14 years | 693 |
| 15 to 19 years | 452 |
| 20 to 24 years | 354 |
| 25 to 29 years | 396 |
| 30 to 34 years | 583 |
| 35 to 39 years | 549 |
| 40 to 44 years | 631 |
| 45 to 49 years | 814 |
| 50 to 54 years | 441 |
| 55 to 59 years | 490 |
| 60 to 64 years | 516 |
| 65 to 69 years | 382 |
| 70 to 74 years | 342 |
| 75 to 79 years | 184 |
| 80 to 84 years | 91 |
| 85 years and over | 368 |
Race & Ethnicity
| Racial/Ethnic Groups | Percent |
|---|---|
| White | 6587 |
| Black or African American | 161 |
| American Indian and Alaska Native | 10 |
| Native Hawaiian and Other Pacific Islander | 2 |
| Some Other Race | 115 |
| Two or more races | 423 |
