Reverse Phone Number Lookup in Maryland
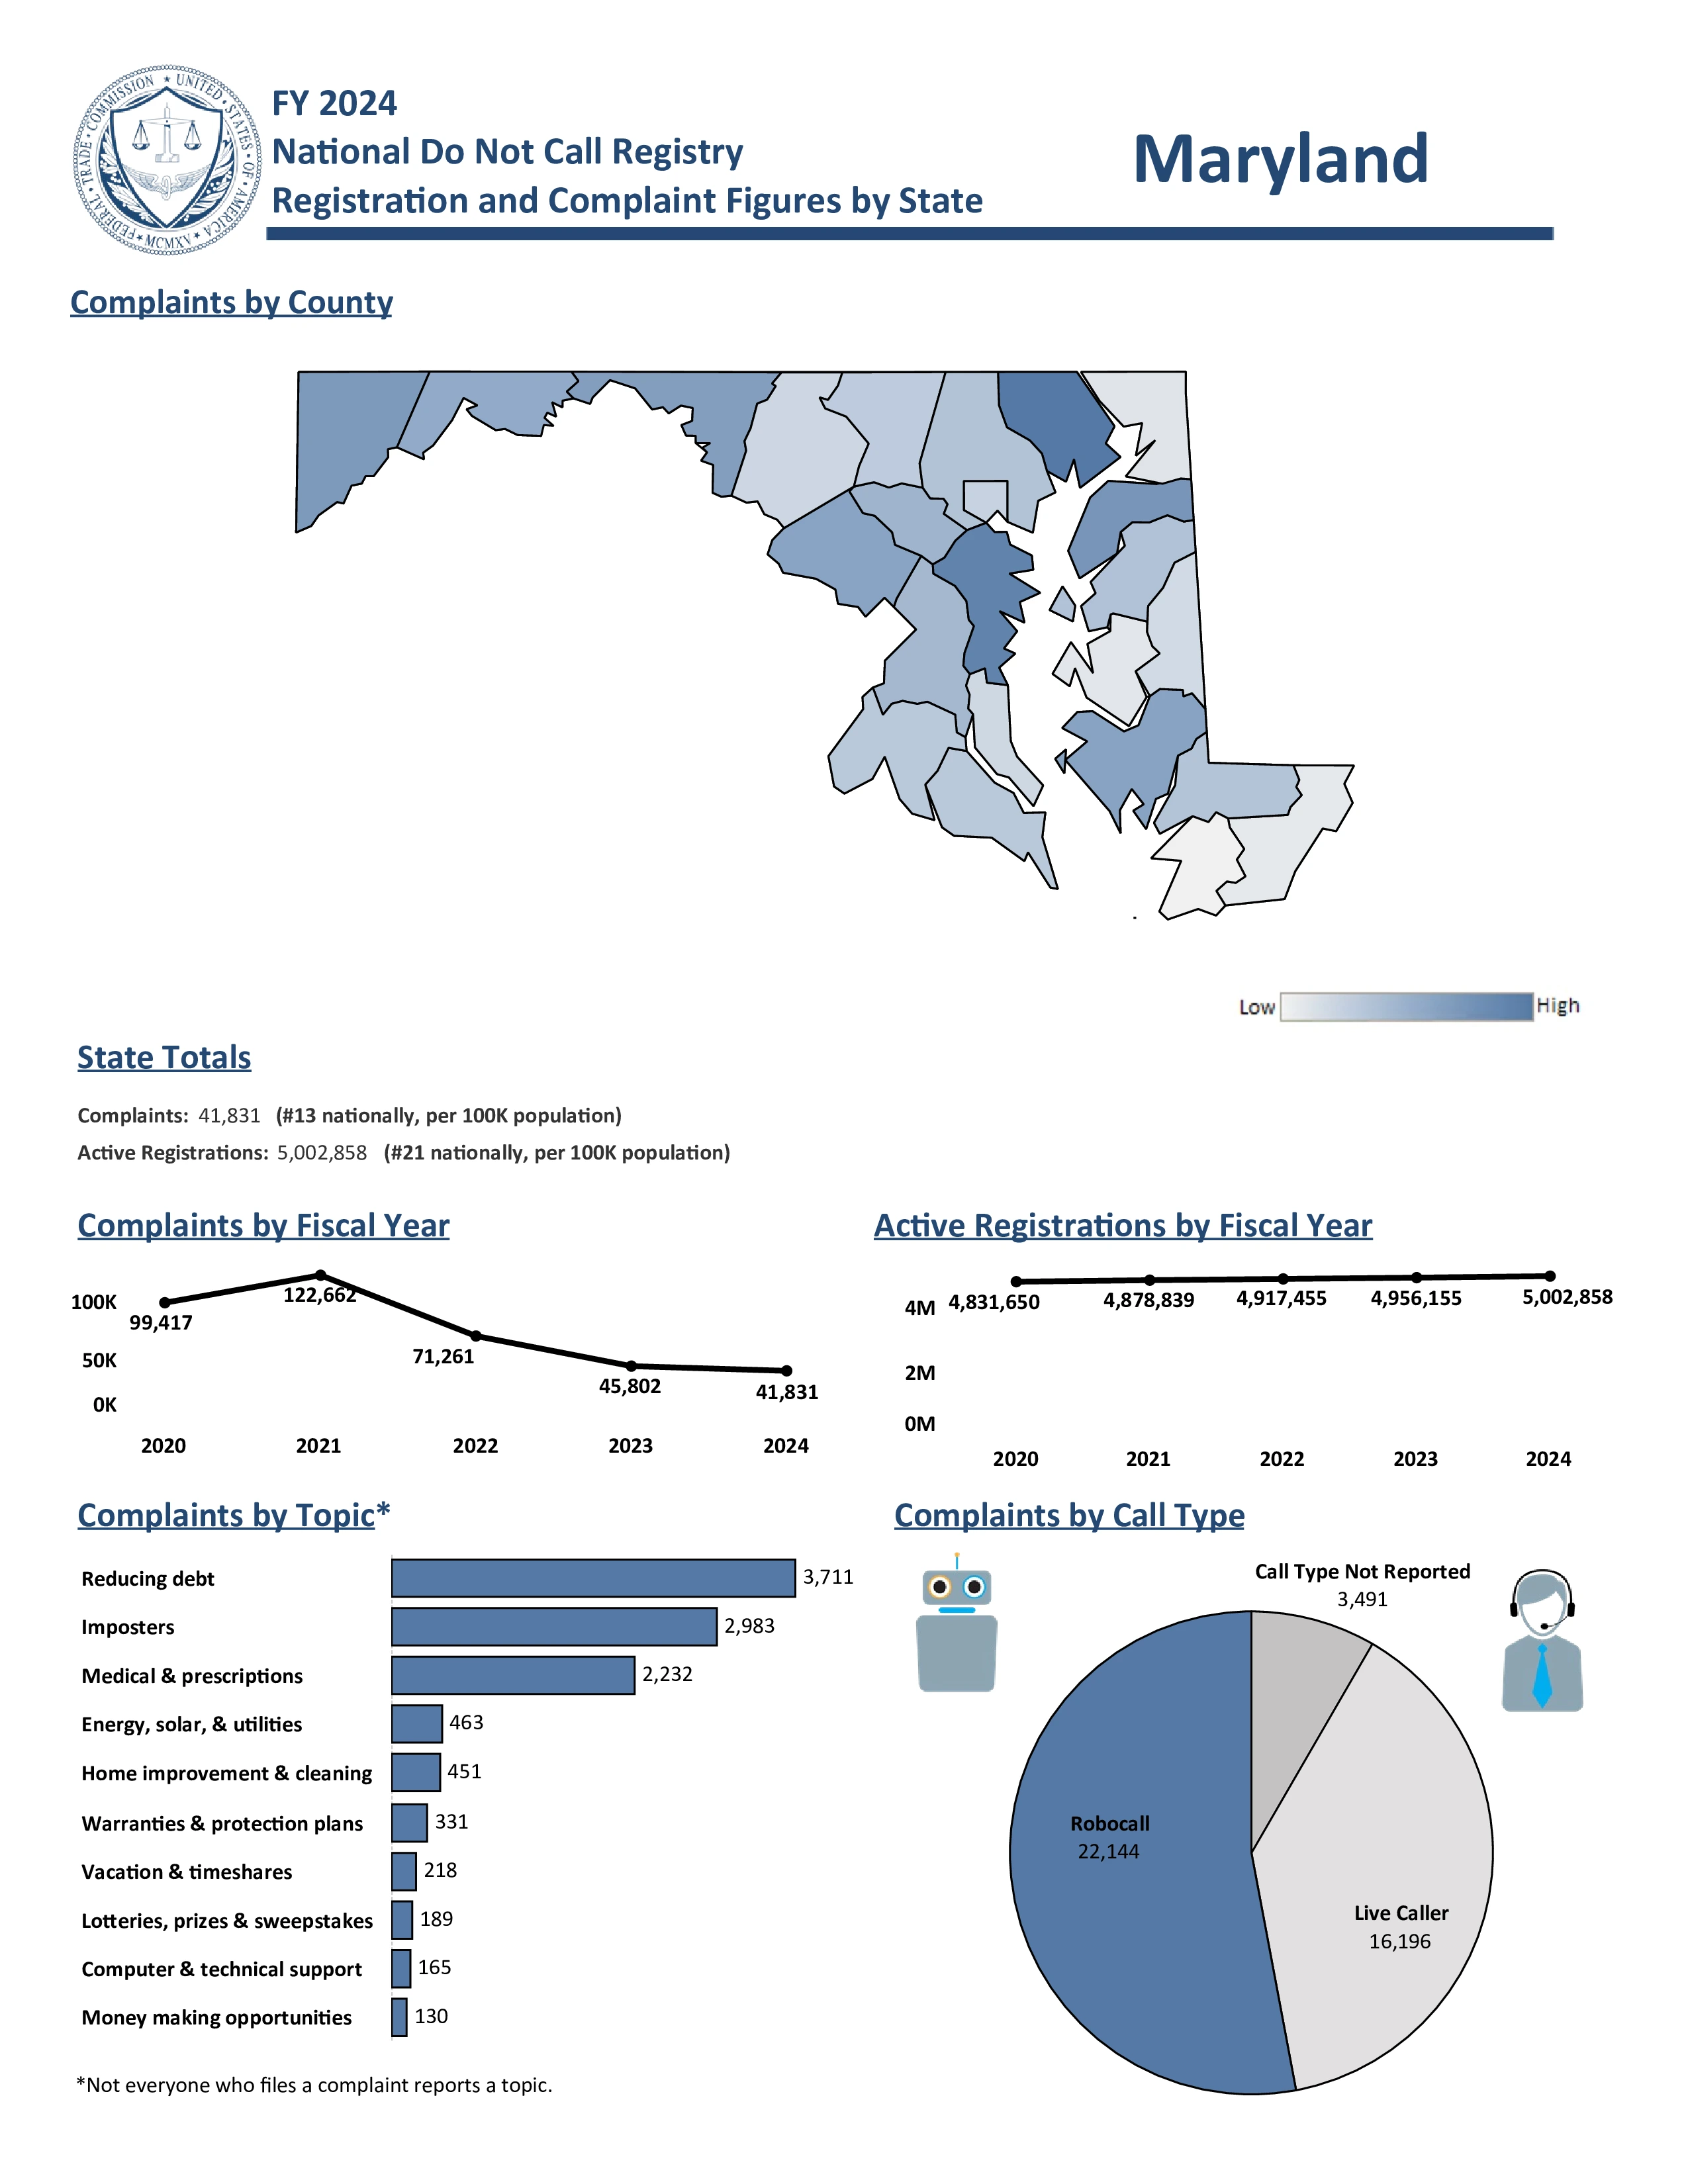
Maryland has approximately 9.2 million active phone numbers. Cell phones are the dominant type with 7.2 million users, while traditional landlines are much less common, with only 412,000 connections statewide. Internet phone services account for about 1.6 million numbers.
This breakdown indicates that searching a Maryland phone number will likely lead to a cell phone. The decline in landlines suggests that newer numbers may have less publicly available information compared to older landline numbers.
Maryland Voice Subscriptions (in thousands):
| Service Type |
June 2023 |
Dec 2023 |
June 2024 |
| Mobile telephony |
7,055 |
7,176 |
7,255 |
| Local exchange telephone service |
478 |
443 |
412 |
| VoIP subscriptions |
1,659 |
1,630 |
1,560 |
| Total |
9,192 |
9,249 |
9,227 |
Source: FCC Voice Telephone Services Report
Top 5 US Cell Phone Companies
Most phone numbers are cell phones, and most cell phone numbers come from the top three United States wireless companies. Here are the top five US Cell Phone Companies in Q1 2025:
- Verizon - 146 million customers
- T-Mobile US - 131 million customers
- AT&T Mobility - 118 million customers
- Boost Mobile - 7 million customers
- U.S. Cellular - 4.4 million customers
Maryland Area Code Lookup
To identify the location of an Maryland phone number, you need to understand the North American Numbering Plan (NANP) structure that all Maryland numbers follow: +1 NPA NXX XXXX.
- +1 - Country code indicating the United States
- NPA - The area code reveals the geographic region where the number was originally assigned
- NXX - Central office code that locates the specific neighborhood and identifies the service provider
- XXXX - Subscriber number identifies the individual phone line within that local exchange
The area code (NPA) is your key to determining location. By matching the three-digit area code to Maryland's regional assignments, you can identify which part of the state the phone number originates from. Each area code corresponds to specific cities and counties throughout Maryland, making it possible to narrow down the caller's general location.
Here's a complete list of Maryland area codes with major cities:
For latest Maryland phone numbering regulations, contact Alden Manka at the Maryland PSC via [email protected] or 410-767-8007.
Important: Area codes can only tell you where a phone number was originally assigned, not where the phone number owner currently lives. Due to number portability and mobile/VoIP services, the actual user location may be completely different today. For accurate owner information and current details, use our reverse phone lookup tool above.