Edgewater Phone Book
Public Schools
Museums
Alternative Fuel Stations
Edgewater Reverse Phone Lookup
Browse Chicago phone numbers by rate center and prefix.
Edgewater Phone Numbers
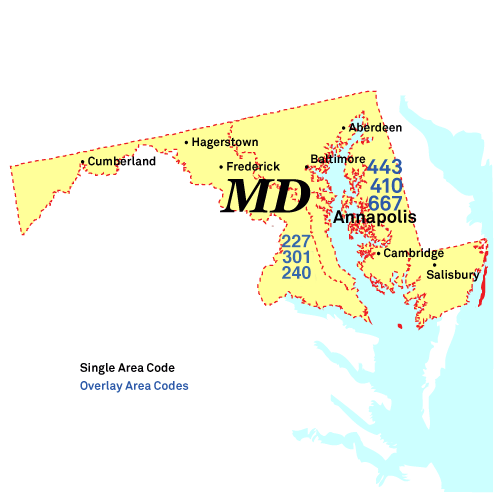
Rate Center: Annapolis (ANNAPOLIS)
Phone numbers with the Annapolis rate center prefixes:
- Phone Numbers 410-212-....
- Phone Numbers 410-216-....
- Phone Numbers 410-224-....
- Phone Numbers 410-263-....
- Phone Numbers 410-266-....
- Phone Numbers 410-267-....
- Phone Numbers 410-268-....
- Phone Numbers 410-271-....
- Phone Numbers 410-279-....
- Phone Numbers 410-280-....
- Phone Numbers 410-293-....
- Phone Numbers 410-295-....
- Phone Numbers 410-320-....
- Phone Numbers 410-349-....
- Phone Numbers 410-353-....
- Phone Numbers 410-507-....
- Phone Numbers 410-533-....
- Phone Numbers 410-562-....
- Phone Numbers 410-570-....
- Phone Numbers 410-571-....
- Phone Numbers 410-573-....
- Phone Numbers 410-626-....
- Phone Numbers 410-693-....
- Phone Numbers 410-703-....
- Phone Numbers 410-757-....
- Phone Numbers 410-858-....
- Phone Numbers 410-897-....
- Phone Numbers 410-919-....
- Phone Numbers 410-934-....
- Phone Numbers 410-956-....
- Phone Numbers 410-972-....
- Phone Numbers 410-980-....
- Phone Numbers 410-990-....
- Phone Numbers 410-991-....
- Phone Numbers 443-214-....
- Phone Numbers 443-221-....
- Phone Numbers 443-223-....
- Phone Numbers 443-254-....
- Phone Numbers 443-321-....
- Phone Numbers 443-336-....
- Phone Numbers 443-370-....
- Phone Numbers 443-433-....
- Phone Numbers 443-440-....
- Phone Numbers 443-454-....
- Phone Numbers 443-458-....
- Phone Numbers 443-481-....
- Phone Numbers 443-482-....
- Phone Numbers 443-510-....
- Phone Numbers 443-534-....
- Phone Numbers 443-569-....
- Phone Numbers 443-603-....
- Phone Numbers 443-714-....
- Phone Numbers 443-716-....
- Phone Numbers 443-758-....
- Phone Numbers 443-775-....
- Phone Numbers 443-808-....
- Phone Numbers 443-822-....
- Phone Numbers 443-837-....
- Phone Numbers 443-852-....
- Phone Numbers 443-871-....
- Phone Numbers 443-875-....
- Phone Numbers 443-924-....
- Phone Numbers 443-926-....
- Phone Numbers 443-949-....
- Phone Numbers 443-994-....
- Phone Numbers 443-995-....
- Phone Numbers 667-225-....
Maryland City Phone Books
- Baltimore, MD Phone Book
- Columbia, MD Phone Book
- Germantown, MD Phone Book
- Silver Spring, MD Phone Book
- Waldorf, MD Phone Book
- Ellicott City, MD Phone Book
- Frederick, MD Phone Book
- Glen Burnie, MD Phone Book
- Rockville, MD Phone Book
- Gaithersburg, MD Phone Book
- Bethesda, MD Phone Book
- Dundalk, MD Phone Book
- Bowie, MD Phone Book
- Towson, MD Phone Book
- Bel Air South, MD Phone Book
- Aspen Hill, MD Phone Book
- Severn, MD Phone Book
- Wheaton, MD Phone Book
- North Bethesda, MD Phone Book
- Potomac, MD Phone Book
- Odenton, MD Phone Book
- Catonsville, MD Phone Book
- , MD Phone Book
- Hagerstown, MD Phone Book
- Annapolis, MD Phone Book
- Essex, MD Phone Book
- Severna Park, MD Phone Book
- Clinton, MD Phone Book
- Randallstown, MD Phone Book
- Olney, MD Phone Book
- Owings Mills, MD Phone Book
- Montgomery Village, MD Phone Book
- Chillum, MD Phone Book
- Pikesville, MD Phone Book
- Salisbury, MD Phone Book
- College Park, MD Phone Book
- Bel Air North, MD Phone Book
- Eldersburg, MD Phone Book
- Parkville, MD Phone Book
- Milford Mill, MD Phone Book
- Middle River, MD Phone Book
- Carney, MD Phone Book
- Crofton, MD Phone Book
- Pasadena, MD Phone Book
- Reisterstown, MD Phone Book
- Perry Hall, MD Phone Book
- South Laurel, MD Phone Book
- Ilchester, MD Phone Book
- Clarksburg, MD Phone Book
- Laurel, MD Phone Book
- Fairland, MD Phone Book
- Lochearn, MD Phone Book
- Suitland, MD Phone Book
- Edgewood, MD Phone Book
Local Time in Edgewater, MD
Local Time
05:31 AM
Date
Tuesday, July 01, 2025
Time Zone
EDT
Edgewater, MD Population
Edgewater has a population of 8850 people. Sex ratio is 105.90 males per 100 females.
Population by Age
The median age in Edgewater is 34.8 years.
| Age Groups | Population |
|---|---|
| Under 5 years | 499 |
| 5 to 9 years | 497 |
| 10 to 14 years | 372 |
| 15 to 19 years | 425 |
| 20 to 24 years | 326 |
| 25 to 29 years | 696 |
| 30 to 34 years | 611 |
| 35 to 39 years | 691 |
| 40 to 44 years | 696 |
| 45 to 49 years | 465 |
| 50 to 54 years | 838 |
| 55 to 59 years | 560 |
| 60 to 64 years | 544 |
| 65 to 69 years | 528 |
| 70 to 74 years | 348 |
| 75 to 79 years | 388 |
| 80 to 84 years | 213 |
| 85 years and over | 153 |
Race & Ethnicity
| Racial/Ethnic Groups | Percent |
|---|---|
| White | 7560 |
| Black or African American | 258 |
| American Indian and Alaska Native | 39 |
| Native Hawaiian and Other Pacific Islander | 3 |
| Some Other Race | 481 |
| Two or more races | 854 |