Reverse Phone Number Lookup in Indiana
A reverse phone lookup in Indiana provides fast access to the name and address behind any phone number through publicly available government databases. This phone search lookup helps Hoosiers know who's calling before picking up or calling back. Use this reverse search to differentiate real callers from spam and protect yourself from scammers while not missing important calls.
Reverse Phone Lookup by Indiana Area Code
All Indiana phone numbers consist of three parts: the three-digit Area Code,
the three-digit Prefix Code (also known as the exchange or central office code),
and the final four-digit line number. While the area code narrows down the
location to a large region, the prefix code can often specify the original city
or town where the number was registered.

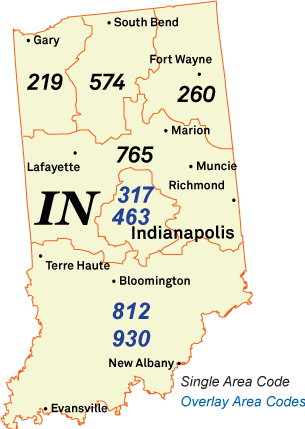
Here's a complete list of Indiana area codes:
Area Code 219: Hammond, Gary, Portage
Location: The 219 area code covers the northwestern corner of Indiana, including major cities like Hammond, Gary, and Merrillville.
Common Callers: Steel mill shift managers (US Steel), BP refinery contractors, and Horseshoe Casino hosts.
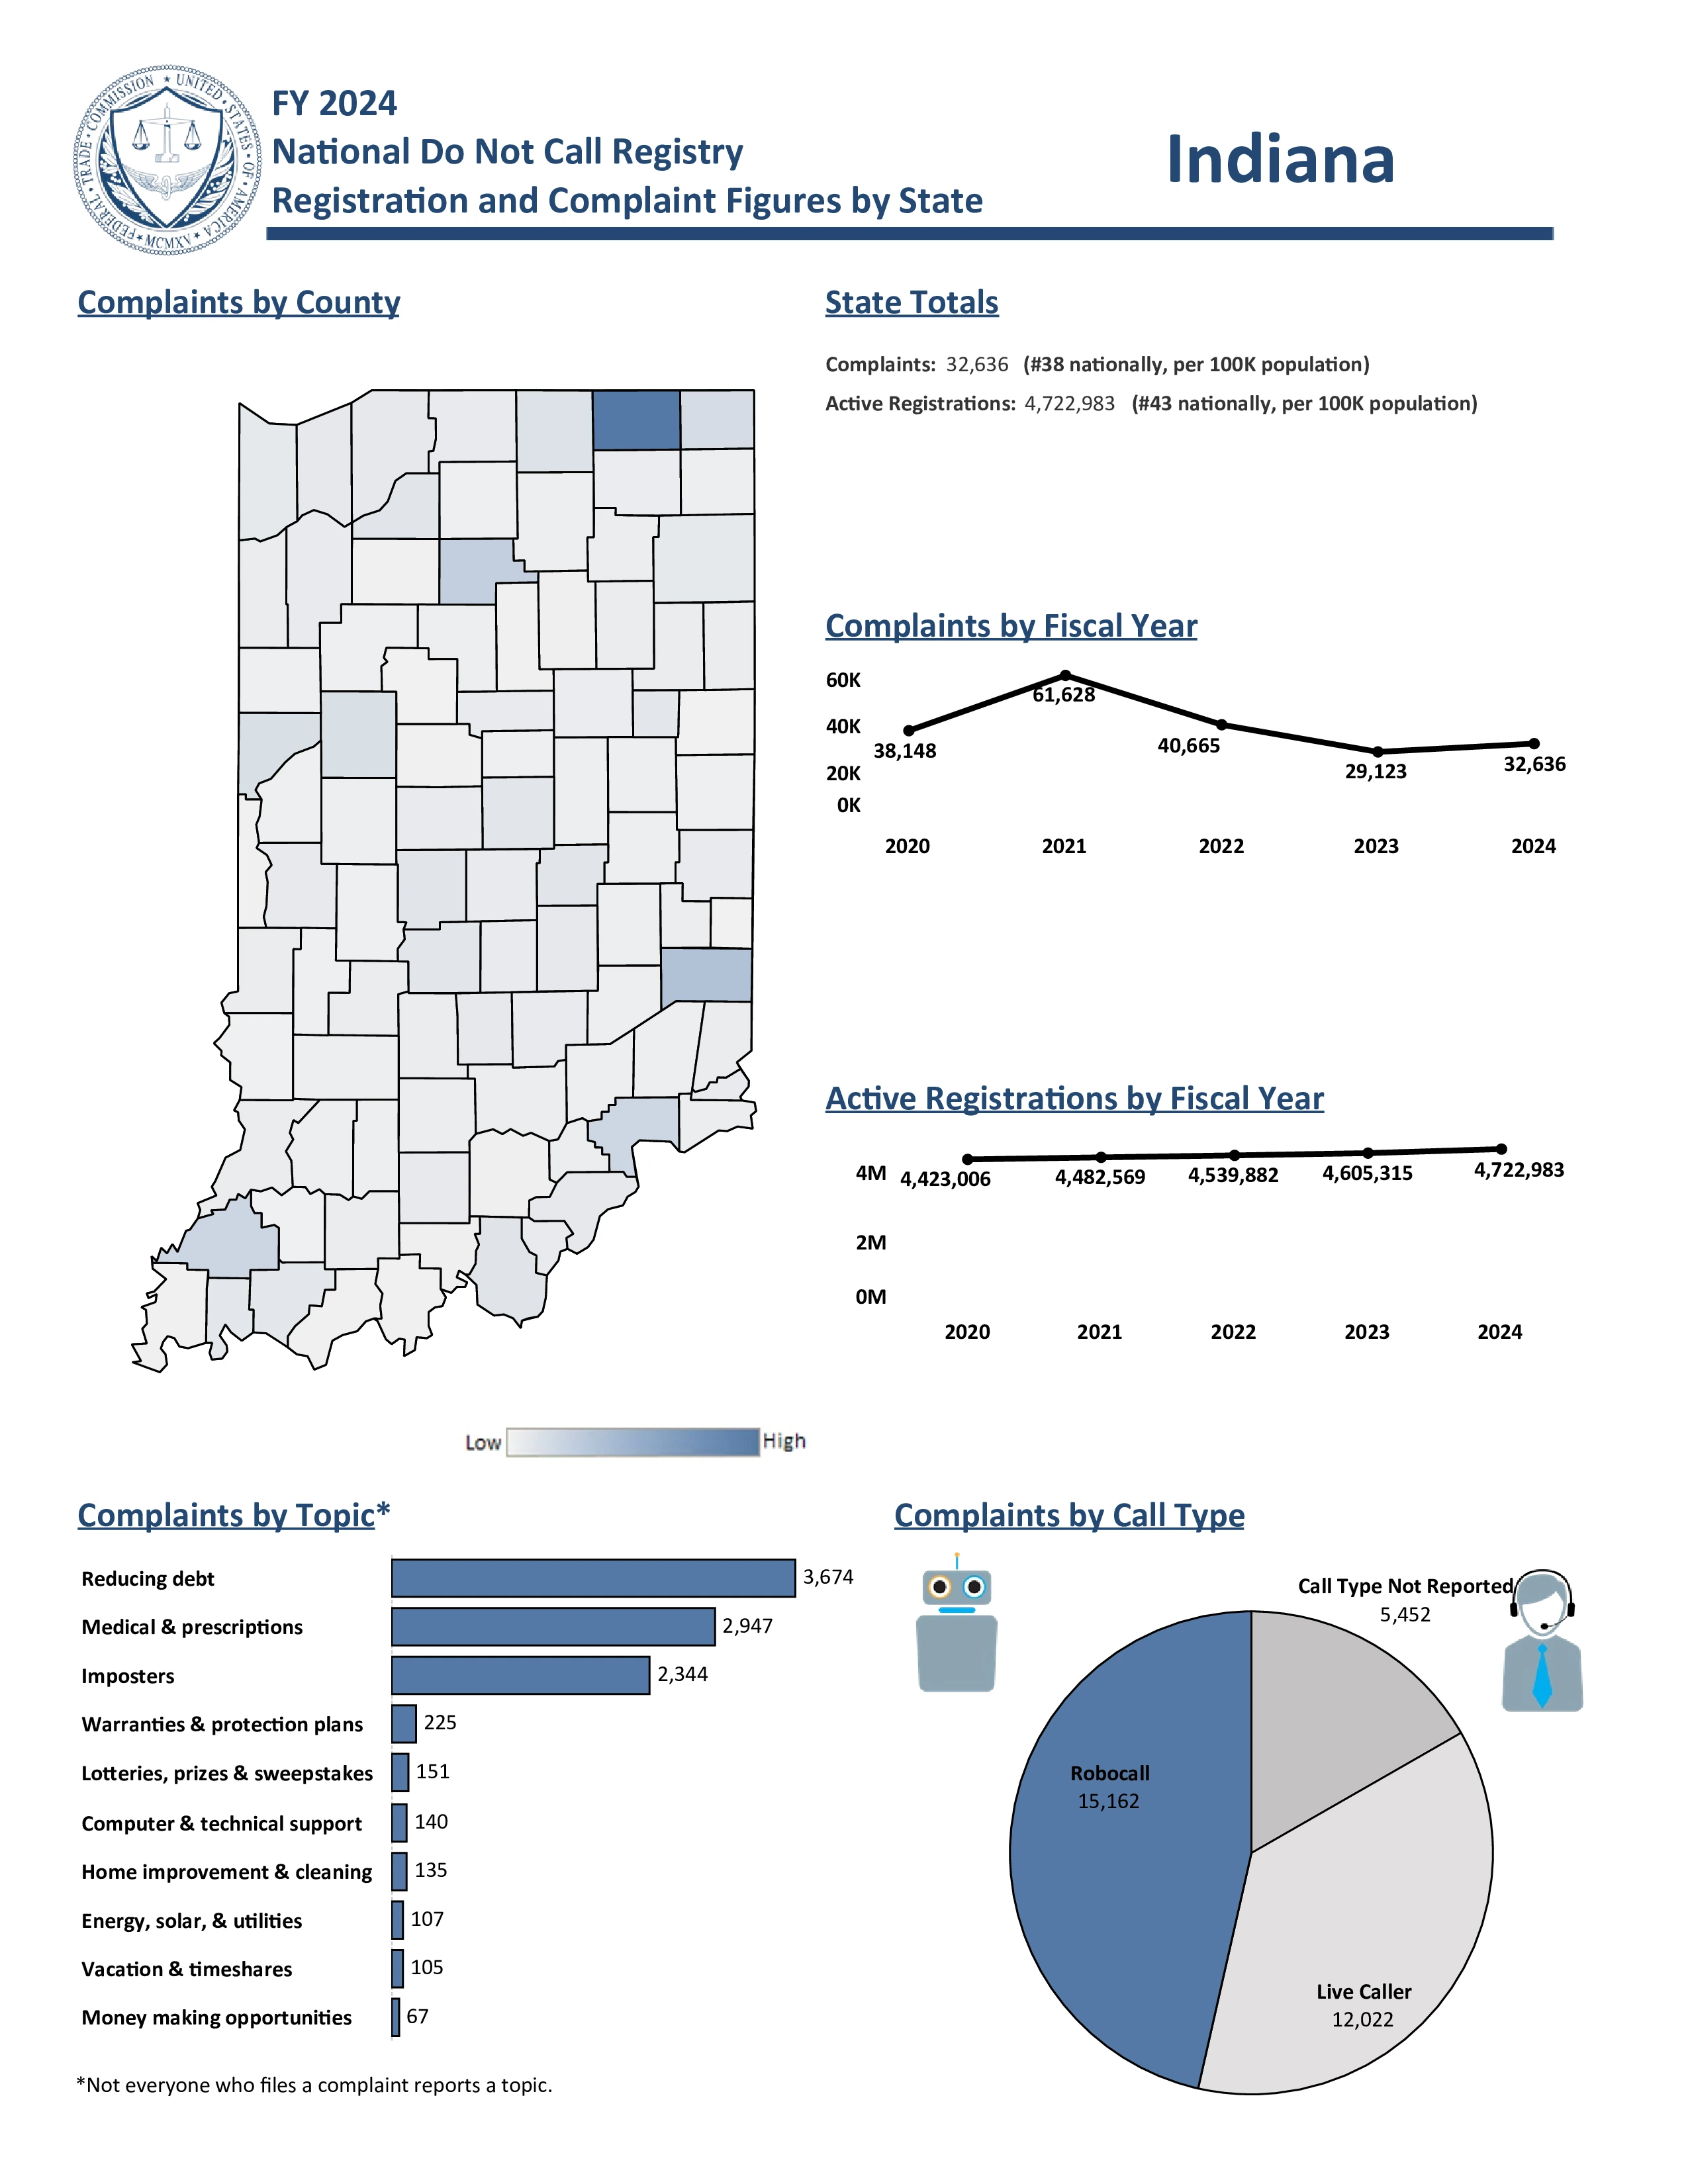
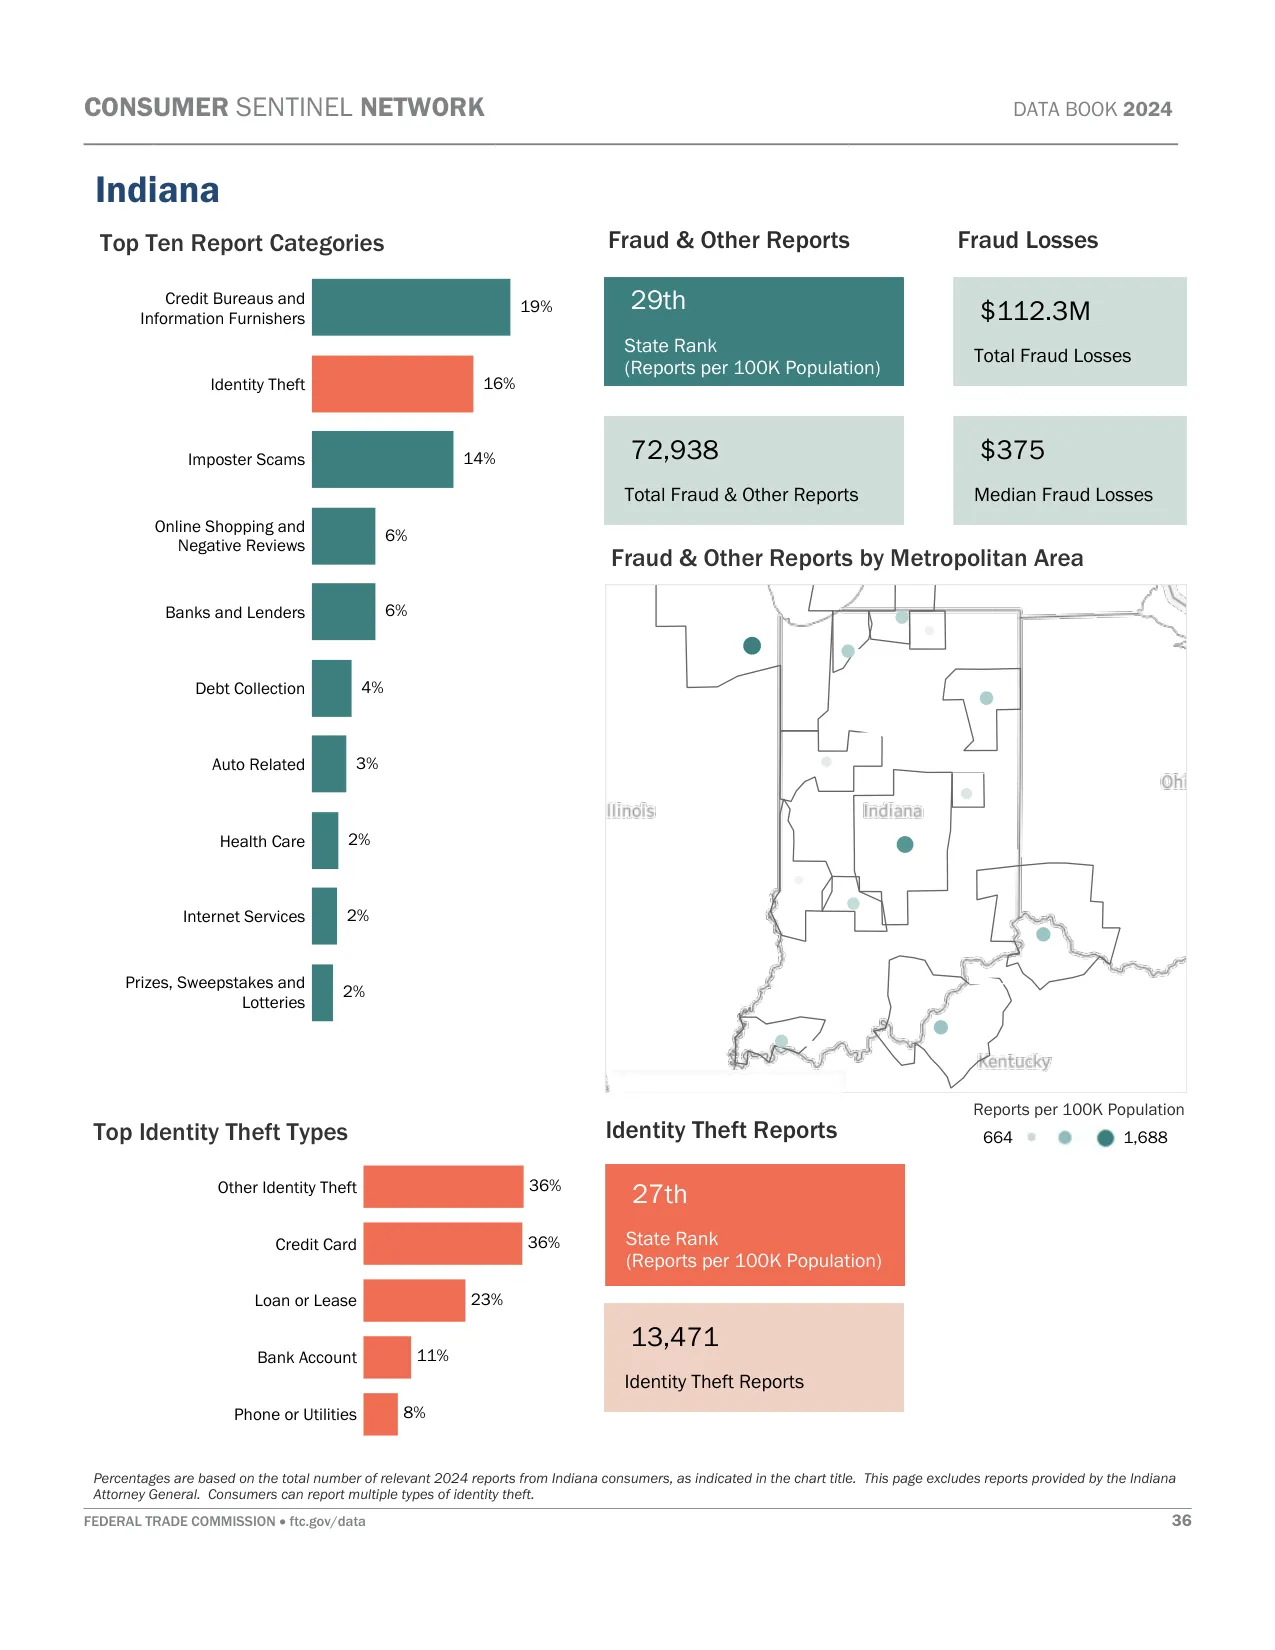
Scams and Spam Calls: The 219 area code is targeted by Aggressive "Police Fund" Harassment calls and "$25,000 Prize Giveaway" scams. Residents also report Vague "Legal Matter" threats, Social Security action scams, and a high volume of Silent or "One Ring" hang-up calls.
Area Code 260: Fort Wayne, Huntington, New Haven
Location: The 260 area code covers northeastern Indiana, including major cities like Fort Wayne, Huntington, and Auburn.
Common Callers: Sweetwater Sound sales engineers, Parkview Health appointment lines, and Lincoln Financial agents.
Scams and Spam Calls: The 260 area code reports Unsolicited Real Estate "Investor" texts and Medicare/Senior Healthcare scams. Fake Legal & Debt Collection threats are frequent, along with Amazon/Retail Delivery scams and Extended Auto Warranty calls.
Area Codes 317/463: Indianapolis, Carmel, Fishers
Location: The 317 and 463 area codes cover central Indiana, including major cities like Indianapolis, Carmel, and Greenwood.
Common Callers: Eli Lilly clinical trial staff, Salesforce marketing cloud support, and NCAA compliance officers.
Scams and Spam Calls: The 317 and 463 area codes encounter AES / IPL Utility Disconnection scams and Card Services Identity Theft scams. Aggressive "We Buy Houses" offers are common, as are Fake Business Loan voicemails, IRS Arrest threats, and "Can You Hear Me?" voice phishing.
Area Code 574: South Bend, Elkhart, Mishawaka
Location: The 574 area code covers northern Indiana, including major cities like South Bend, Elkhart, and Warsaw.
Common Callers: Notre Dame alumni association, RV manufacturing sales reps (Thor), and orthopedic device sales.
Scams and Spam Calls: The 574 area code is dealing with Apple iCloud Support scams and Fake Package Delivery notifications. Unsolicited Home Buyer texts are reported, along with Fake Police Charity donations and Social Security/Debt threats.
Area Code 765: Muncie, Lafayette, Anderson
Location: The 765 area code covers central and west-central Indiana, including major cities like Muncie, Lafayette, and Kokomo.
Common Callers: Purdue University admissions, Subaru automotive plant HR, and Ball State alumni relations.
Scams and Spam Calls: The 765 area code is targeted by Online Romance scams and Fake Legal Action/Pending Case threats. Residents also face Fake Package & Retail Fraud alerts, Student Loan Forgiveness scams, and Aggressive Vehicle Warranty robocalls.
Area Codes 812/930: Evansville, Bloomington, Terre Haute
Location: The 812 and 930 area codes cover southern Indiana, including major cities like Evansville, Bloomington, and Terre Haute.
Common Callers: Indiana University Bloomington staff, Toyota manufacturing recruiters, and Berry Global logistics.
Scams and Spam Calls: The 812 and 930 area codes report Fake Job & Recruitment scams and "Wrong Number" Text Bait. "Can You Hear Me?" Voice-Fishing is persistent, along with Computer/Tech Support scams and Aggressive Debt Collection.
Important: Area codes show where a number was originally assigned, not where the caller currently lives. Federal number portability laws
allow people to keep their phone numbers when moving or switching carriers. Use our reverse phone lookup tool above to get detailed phone number owner information.
For latest Indiana phone numbering regulations, contact Kendall Querry at the Indiana URC via [email protected] or 317-233-5249.
Indiana Phone Numbers
Indiana boasts approximately 8.7 million active phone numbers. Mobile phones dominate with 7.3 million users, while traditional landlines are declining, registering just 330,000 connections across the state. Internet phone services account for roughly 1 million numbers.
When searching for an Indiana phone number, it's highly probable it's a cell phone. The decrease in landlines suggests that more recent phone numbers may be harder to trace than older landline numbers, which traditionally had greater public accessibility.
Indiana Voice Subscriptions (in thousands):
| Service Type |
June 2023 |
Dec 2023 |
June 2024 |
| Mobile telephony |
7,120 |
7,242 |
7,324 |
| Local exchange telephone service |
393 |
358 |
330 |
| VoIP subscriptions |
1,041 |
1,012 |
1,027 |
| Total |
8,554 |
8,612 |
8,681 |
Source: FCC Voice Telephone Services Report
Top 5 US Cell Phone Companies
Most phone numbers are cell phones, and most cell phone numbers come from the top three United States wireless companies. Here are the top five US Cell Phone Companies in Q1 2025:
- Verizon - 146 million customers
- T-Mobile US - 131 million customers
- AT&T Mobility - 118 million customers
- Boost Mobile - 7 million customers
- U.S. Cellular - 4.4 million customers


