Indiana has 8 active area codes stretching from 219 in the Chicago suburbs to 812 in Evansville near the Kentucky border. Callers using 317 Indianapolis numbers frequently pose as Social Security or disability benefit representatives claiming your benefits are at risk, and silent or one-ring calls designed to confirm your number is active are reported across multiple area codes. Getting silent calls or concerning alerts about your benefits? Our Indiana reverse phone lookup can help you screen and block the people behind those numbers.
Scam & Spam Phone Number Lookup
Answering a "can you hear me" call in Indiana often just marks your line for more harassment from health insurance bots. Check the caller ID first to verify the source and block the noise effectively.
Recently Reported Spam Numbers in Indiana
Phone numbers reported as unwanted calls to the FTC by Indiana residents in the last 30 days.
(574) 227-4458
Other
6 reports
·
(786) 732-1038
Other
5 reports
·
(574) 380-4088
Other
4 reports
·
(888) 269-4978
Reducing your debt (credit cards, mortgage, student loans)
4 reports
·
(317) 620-7285
Other
4 reports
·
(930) 205-8495
Other
3 reports
·
(317) 286-2073
Dropped call or no message
3 reports
·
(317) 401-7751
Dropped call or no message
3 reports
·
(219) 300-8136
Other
3 reports
·
(708) 766-8761
Other
3 reports
·
Phone Scams in Indiana
Residents report high volumes of SSA/Disability scams and "Silent" or "One-ring" calls.
In 2024, Indiana residents reported 34,586 fraud cases resulting in total losses of $112,284,529, with a median loss of $375 per victim. Received a fraudulent call or lost money to a phone scam? Report fraud or scam:
In 2024, Indiana residents filed 32,636 unwanted call complaints with the FTC, of which 15,162 were robocalls and 12,022 involved live callers. The most reported complaint topics were reducing debt (3,674), medical and prescriptions (2,947), imposters (2,344).
To reduce spam calls, register all your phone numbers at National Do Not Call Registry (donotcall.gov or call 1-888-382-1222 from the number you want to protect).
Indiana Do Not Call List
Indiana maintains its own Do Not Call list separate from the federal registry, and signing up for both gives you the broadest protection. You can register for free at indonotcall.org or by calling 1-888-834-9969. Once added, your number stays on the list permanently unless you request removal.
Reverse Lookup Indiana Area Codes
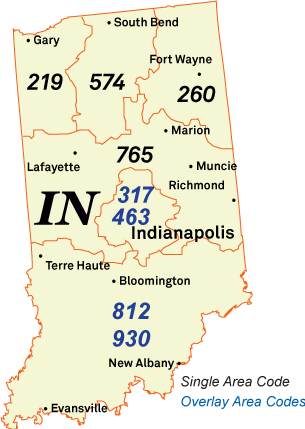
Indianapolis operates on 317, Fort Wayne uses 260, the northwest has 219/464, South Bend runs 574, and southern Indiana claims 812. The table below shows which cities use which codes across the state. When you need more than regional guessing, use the lookup tool above for the owner 's name and address.
Important: Area codes do not guarantee the caller's current location. Indiana allows number portability, and scammers often use "neighbor spoofing" to make calls appear local.
Is It Legal to Do a Reverse Phone Lookup in Indiana?
Yes, reverse phone lookup is legal in Indiana for personal use like caller identification and fraud prevention. Just remember that federal FCRA laws prohibit using lookup data for employment decisions, tenant approvals, or credit assessments.
FAQs
How to opt out of phone number lookup services in Indiana?
Under the Indiana Consumer Data Protection Act (ICDPA), effective Jan. 1, 2026, you can request removal of your phone number and personal information. Visit each reverse lookup site and click "Do Not Sell My Information" to submit a request.
How do I know if a Indiana business phone number is legit?
A reverse phone lookup can provide a business name, but that alone does not confirm legitimacy. While Indiana has over 153,748 business establishments based on Census data, you should verify the company by searching for it in the Indiana Business Search.
Are most Indiana numbers mobile or landline?
Indiana has 7.3 million mobile subscriptions, 1 million VoIP numbers, and 330,000 landlines.