Public Schools
Hospitals
Hotels and Motels
Alternative Fuel Stations
Local Education Agencies
Sullivan Reverse Phone Lookup
Browse Chicago phone numbers by rate center and prefix.
Sullivan Phone Numbers
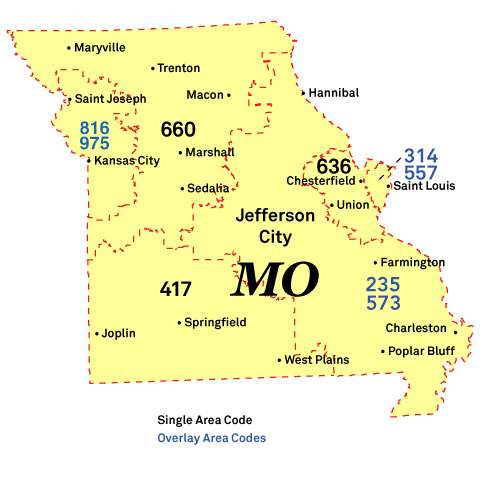
Rate Center: Sullivan (SULLIVAN)
Phone numbers with the Sullivan rate center prefixes:
Illinois City Phone Books
- Kansas City, MO Phone Book
- St. Louis, MO Phone Book
- Springfield, MO Phone Book
- Columbia, MO Phone Book
- Independence, MO Phone Book
- Lee's Summit, MO Phone Book
- O'Fallon, MO Phone Book
- St. Joseph, MO Phone Book
- St. Charles, MO Phone Book
- St. Peters, MO Phone Book
- Blue Springs, MO Phone Book
- Florissant, MO Phone Book
- Joplin, MO Phone Book
- Chesterfield, MO Phone Book
- Jefferson City, MO Phone Book
- Wentzville, MO Phone Book
- Cape Girardeau, MO Phone Book
- Wildwood, MO Phone Book
- University City, MO Phone Book
- Liberty, MO Phone Book
- Ballwin, MO Phone Book
- Raytown, MO Phone Book
- Kirkwood, MO Phone Book
- Gladstone, MO Phone Book
- Maryland Heights, MO Phone Book
- Hazelwood, MO Phone Book
- Grandview, MO Phone Book
- Belton, MO Phone Book
- Nixa, MO Phone Book
- Raymore, MO Phone Book
- Sedalia, MO Phone Book
- Arnold, MO Phone Book
- Ferguson, MO Phone Book
- Warrensburg, MO Phone Book
- Rolla, MO Phone Book
- Ozark, MO Phone Book
- Farmington, MO Phone Book
- Creve Coeur, MO Phone Book
- Kirksville, MO Phone Book
- Hannibal, MO Phone Book
- Poplar Bluff, MO Phone Book
- Clayton, MO Phone Book
- Sikeston, MO Phone Book
- Republic, MO Phone Book
- Jackson, MO Phone Book
- Fort Leonard Wood, MO Phone Book
- Lebanon, MO Phone Book
- Carthage, MO Phone Book
- Jennings, MO Phone Book
- Grain Valley, MO Phone Book
- Washington, MO Phone Book
- Moberly, MO Phone Book
- Marshall, MO Phone Book
- Fulton, MO Phone Book
- Troy, MO Phone Book
- West Plains, MO Phone Book
- Festus, MO Phone Book
- Neosho, MO Phone Book
- Union, MO Phone Book
- Webb City, MO Phone Book
- Excelsior Springs, MO Phone Book
- Maryville, MO Phone Book
- Bridgeton, MO Phone Book
- Mexico, MO Phone Book
- Branson, MO Phone Book
- Bolivar, MO Phone Book
- Kearney, MO Phone Book
- Smithville, MO Phone Book
- Eureka, MO Phone Book
- Harrisonville, MO Phone Book
- Kennett, MO Phone Book
- Chillicothe, MO Phone Book
- Monett, MO Phone Book
- Cameron, MO Phone Book
- Clinton, MO Phone Book
- Pleasant Hill, MO Phone Book
- Park Hills, MO Phone Book
- Perryville, MO Phone Book
- Warrenton, MO Phone Book
- Boonville, MO Phone Book
- Oak Grove, MO Phone Book
- Carl Junction, MO Phone Book
- Nevada, MO Phone Book
- Brentwood, MO Phone Book
- Dexter, MO Phone Book
- Aurora, MO Phone Book
- Marshfield, MO Phone Book
- Bonne Terre, MO Phone Book
- Valley Park, MO Phone Book
- Pacific, MO Phone Book
- Sullivan, MO Phone Book
- St. Robert, MO Phone Book
- Trenton, MO Phone Book
- Richmond, MO Phone Book
- Caruthersville, MO Phone Book
- Charleston, MO Phone Book
- Macon, MO Phone Book
- Waynesville, MO Phone Book
- Bowling Green, MO Phone Book
- Savannah, MO Phone Book
- Imperial, MO Phone Book
- Platte City, MO Phone Book
- Osage Beach, MO Phone Book
- Salem, MO Phone Book
- Mountain Grove, MO Phone Book
- Eldon, MO Phone Book
- Higginsville, MO Phone Book
- North Kansas City, MO Phone Book
- Hollister, MO Phone Book
- Lexington, MO Phone Book
- Lamar, MO Phone Book
- Brookfield, MO Phone Book
- High Ridge, MO Phone Book
- Malden, MO Phone Book
- Butler, MO Phone Book
- Camdenton, MO Phone Book
- Fenton, MO Phone Book
- Fredericktown, MO Phone Book
- Vandalia, MO Phone Book
- Carrollton, MO Phone Book
- Riverside, MO Phone Book
- Cuba, MO Phone Book
- Hillsboro, MO Phone Book
- Louisiana, MO Phone Book
- Cassville, MO Phone Book
- Bethany, MO Phone Book
- Buffalo, MO Phone Book
- Versailles, MO Phone Book
- Houston, MO Phone Book
- Ava, MO Phone Book
- New Madrid, MO Phone Book
- New Haven, MO Phone Book
- Concordia, MO Phone Book
- Thayer, MO Phone Book
- Potosi, MO Phone Book
- Doniphan, MO Phone Book
- Canton, MO Phone Book
- Richland, MO Phone Book
- Hayti, MO Phone Book
- Warsaw, MO Phone Book
- Hermann, MO Phone Book
- Anderson, MO Phone Book
- Lake Ozark, MO Phone Book
- Kahoka, MO Phone Book
- Holden, MO Phone Book
- Hamilton, MO Phone Book
- Albany, MO Phone Book
- Stockton, MO Phone Book
- Claycomo, MO Phone Book
- Gallatin, MO Phone Book
- Ironton, MO Phone Book
- Paris, MO Phone Book
- Ellington, MO Phone Book
- Osceola, MO Phone Book
- Reeds Spring, MO Phone Book
- Mound City, MO Phone Book
- Benton, MO Phone Book
- Hermitage, MO Phone Book
- Gainesville, MO Phone Book
- Kingdom City, MO Phone Book
Local Time in Sullivan, MO
Local Time
01:56 AM
Date
Wednesday, April 30, 2025
Time Zone
CDT
Sullivan, MO Population
Chicago has a population of 6499 people. Sex ratio is 93.90 males per 100 females.
Population by Age
The median age in Chicago is 34.8 years.
| Age Groups | Population |
|---|---|
| Under 5 years | 468 |
| 5 to 9 years | 338 |
| 10 to 14 years | 284 |
| 15 to 19 years | 377 |
| 20 to 24 years | 411 |
| 25 to 29 years | 505 |
| 30 to 34 years | 330 |
| 35 to 39 years | 337 |
| 40 to 44 years | 377 |
| 45 to 49 years | 439 |
| 50 to 54 years | 300 |
| 55 to 59 years | 351 |
| 60 to 64 years | 672 |
| 65 to 69 years | 254 |
| 70 to 74 years | 304 |
| 75 to 79 years | 317 |
| 80 to 84 years | 102 |
| 85 years and over | 333 |
Race & Ethnicity
| Racial/Ethnic Groups | Percent |
|---|---|
| White | 6402 |
| Black or African American | 32 |
| American Indian and Alaska Native | 27 |
| Native Hawaiian and Other Pacific Islander | 1 |
| Some Other Race | 60 |
| Two or more races | 347 |