Reverse Phone Number Lookup in Missouri
Reverse phone lookup in Missouri helps identify the person or business behind any phone number using public government databases. Missourians rely on this number search to screen calls, verify identities, and protect against unwanted contact. This phone search lookup helps determine whether unknown numbers belong to legitimate contacts or potential threats.
Reverse Phone Lookup by Missouri Area Code
All Missouri phone numbers consist of three parts: the three-digit Area Code,
the three-digit Prefix Code (also known as the exchange or central office code),
and the final four-digit line number. While the area code narrows down the
location to a large region, the prefix code can often specify the original city
or town where the number was registered.

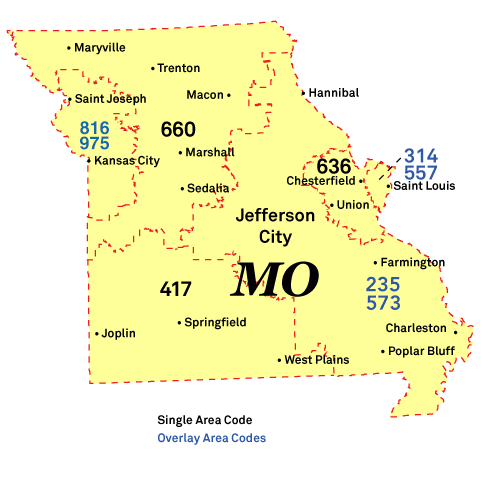
Here's a complete list of Missouri area codes:
Area Codes 235/573: Columbia, Jefferson City, Cape Girardeau
Location: The 235 and 573 area codes cover eastern Missouri, outside of the St. Louis metropolitan area, including major cities like Columbia, Jefferson City, and Cape Girardeau.
Common Callers: University of Missouri (Mizzou) admissions, Missouri State government, and Fort Leonard Wood housing.
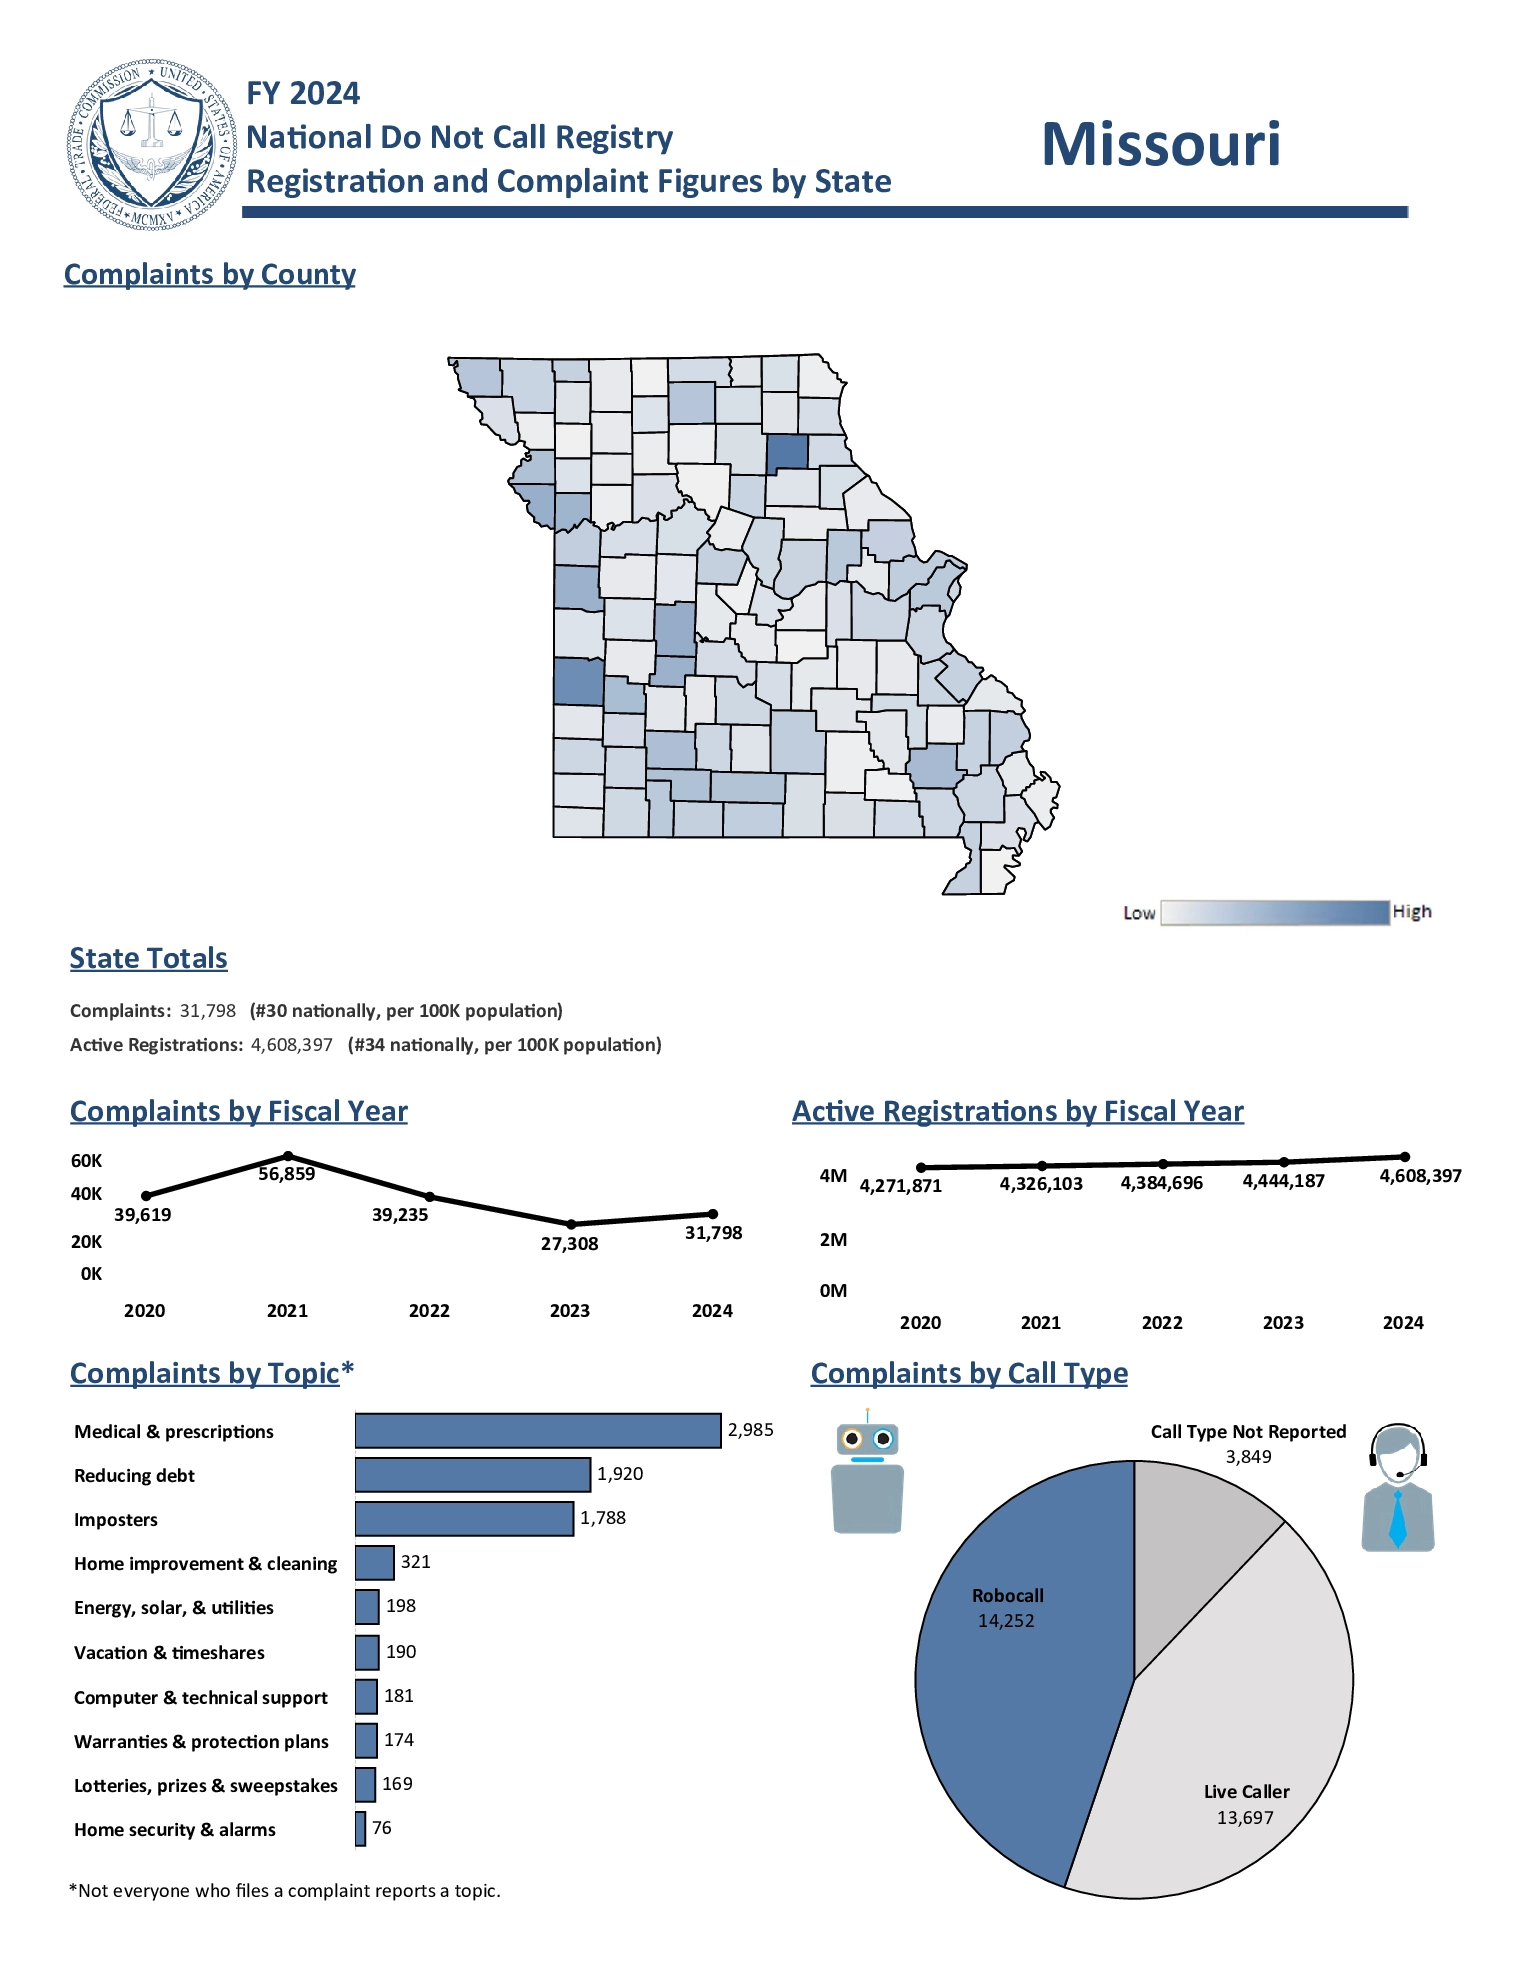
Scams and Spam Calls: The 235 and 573 area codes deal with Suspicious Job Offers and Fake Charity & Fundraising Appeals. Fake Legal Action & Process Server threats are common, along with Phony Debt Collection demands and Bogus Amazon & Tech Renewal charges.
Area Codes 314/557: St. Louis, Florissant, Oakville
Location: The 314 and 557 area codes cover the St. Louis metropolitan area in Missouri, including major cities like St. Louis, Florissant, and Kirkwood.
Common Callers: Washington University/BJC Health schedulers, Wells Fargo advisors, and Anheuser-Busch InBev corporate.
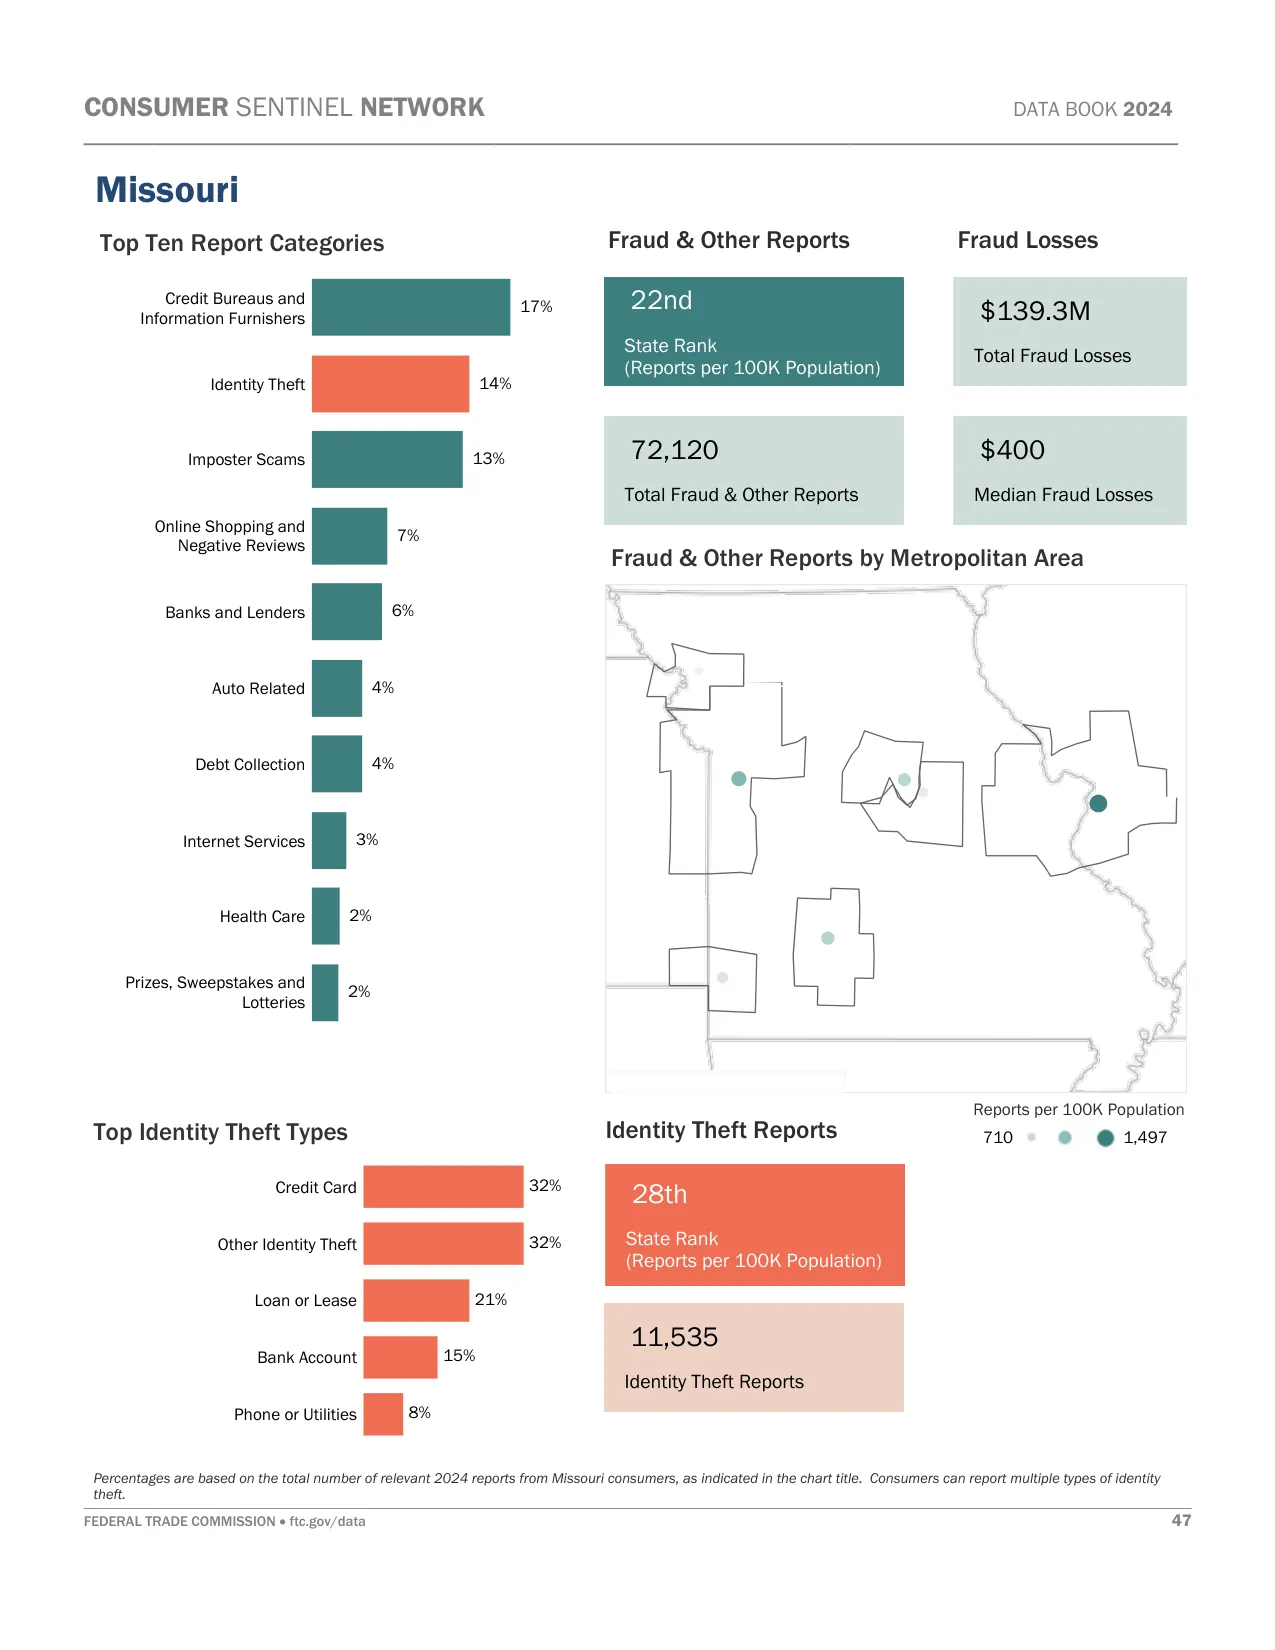
Scams and Spam Calls: The 314 and 557 area codes are targeted by Aggressive Medicare & Medical Equipment scams and Unsolicited "We Buy Houses" calls & texts. Fake Government & IRS Arrest Warrants are frequent, as are Apple & Amazon Account Security scams and Social Security threats.
Area Code 417: Springfield, Joplin, Nixa
Location: The 417 area code covers southwestern Missouri, including major cities like Springfield, Joplin, and Branson.
Common Callers: Bass Pro Shops HQ, O'Reilly Auto Parts corporate, CoxHealth nurses, and Branson show ticket agents.
Scams and Spam Calls: The 417 area code gets Timeshare Exit Scams and Phony Police & Firefighter Charity scams. Brand Impersonation (Amazon, Tech Support, Banks) is reported, along with Medicare & Medical Supply scams and Vague Legal/Debt threats.
Area Code 636: O'Fallon, St. Charles, St. Peters
Location: The 636 area code covers the western suburbs of the St. Louis metropolitan area in Missouri, including major cities like O'Fallon, St. Charles, and Chesterfield.
Common Callers: Mastercard global operations support, Citi call center agents, and Boeing defense recruiters.
Scams and Spam Calls: The 636 area code reports constant Car Shield Warranty robocalls and Credit Card Interest Rate Reduction calls. Fake Publishers Clearinghouse Prize scams are common, as are Aggressive "We Buy Houses" robocalls and Fake Legal Action threats.
Area Code 660: Sedalia, Warrensburg, Kirksville
Location: The 660 area code covers northern and west-central Missouri, including major cities like Sedalia, Kirksville, and Maryville.
Common Callers: Whiteman Air Force Base personnel, Tyson Foods plant HR, and University of Central Missouri staff.
Scams and Spam Calls: The 660 area code is dealing with Unsolicited Business Funding scams and Vague Processing & Debt Collection threats. The "Can You Hear Me?" scam is reported, along with Student Loan Forgiveness scams and Medicare & Medical Equipment schemes.
Area Codes 816/975: Kansas City, Independence, Lee's Summit
Location: The 816 and 975 area codes cover the Kansas City metropolitan area in Missouri, including major cities like Kansas City, Independence, and Lee's Summit.
Common Callers: Oracle Cerner support, H&R Block tax specialists, Ford Kansas City assembly HR, and Hallmark Cards corporate.
Scams and Spam Calls: The 816 and 975 area codes are targeted by Evergy Utility Shut-off scams and Aggressive "We Buy Houses" offers. Fake Subscription Renewal Phishing is common, as are Fake Legal Action/Process Server threats and Medicare robocalls.
Important: Area codes show where a number was originally assigned, not where the caller currently lives. Federal number portability laws
allow people to keep their phone numbers when moving or switching carriers. Use our reverse phone lookup tool above to get detailed phone number owner information.
For latest Missouri phone numbering regulations, contact Kari Salsman at the Missouri PSC via [email protected] or 573-526-5630.
Missouri Phone Numbers
Missouri has approximately 7.9 million active phone numbers. Cell phones are the dominant type with 6.6 million users, while traditional landlines are declining, now with approximately 300,000 connections statewide. Internet phone services account for about 1 million numbers.
When tracing a Missouri phone number, it's highly probable that it's a cell phone. The decreasing prevalence of landlines suggests that newer numbers might be more challenging to trace compared to older landline numbers, which typically had more readily available public information.
Missouri Voice Subscriptions (in thousands):
| Service Type |
June 2023 |
Dec 2023 |
June 2024 |
| Mobile telephony |
6,512 |
6,593 |
6,629 |
| Local exchange telephone service |
389 |
352 |
300 |
| VoIP subscriptions |
985 |
972 |
1,012 |
| Total |
7,886 |
7,917 |
7,941 |
Source: FCC Voice Telephone Services Report
Top 5 US Cell Phone Companies
Most phone numbers are cell phones, and most cell phone numbers come from the top three United States wireless companies. Here are the top five US Cell Phone Companies in Q1 2025:
- Verizon - 146 million customers
- T-Mobile US - 131 million customers
- AT&T Mobility - 118 million customers
- Boost Mobile - 7 million customers
- U.S. Cellular - 4.4 million customers


