Reverse Phone Lookup Independence, KY

Find out who called from that unknown Independence number using our free reverse phone lookup service. Enter the full 10-digit number (including 859 or any other US area code) to search for available caller information including name, address, phone carrier, and more.

Federal Data Sources

Federal Data

State Data Sources

State Data

County Data Sources

County Data

City Data Sources

City Data

Jump to: Phone Book Reverse Lookup Area Code Map Population

Public Schools

Kenton Elementary School

11246 Madison Pk, Independence, KY 41051

Twenhofel Middle School

11846 Taylor Mill Rd, Independence, KY 41051

White'S Tower Elementary School

2977 Harris Pk, Independence, KY 41051

Summit View Academy

5006 Madison Pike, Independence, KY 41051

Beechgrove Elementary School

1029 Bristow Rd, Independence, KY 41051

Simon Kenton High School

11132 Madison Pk, Independence, KY 41051

Libraries

William E. Durr Branch

1992 Walton Nicholson Road, Independence, KY 41051-7906

Fire Departments

Independence Fire District

1980 Delaware Crossing, Independence, KY 41051

Police Departments

Independence Police Department

5409 Madison Pike, Independence, KY 41051-8656

Independence Reverse Phone Lookup

Browse Chicago phone numbers by rate center and prefix.

Independence Phone Numbers

Rate Center: Independence (INDEPNDNCE)

Phone numbers with the Independence rate center prefixes:

Independence Area Code

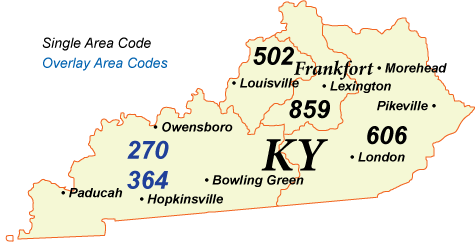
Independence, KY area codes are 859.

Kentucky Area Codes Map

Chicago, Illinois Area Code Map

Local Time in Independence, KY

Local Time
05:50 AM

Date
Saturday, July 05, 2025

Time Zone
EDT

Independence, KY Population

Independence has a population of 28119 people. Sex ratio is 98.30 males per 100 females.

Population by Age

The median age in Independence is 34.8 years.

Age Groups Population
Under 5 years 2305
5 to 9 years 2136
10 to 14 years 2120
15 to 19 years 1675
20 to 24 years 1561
25 to 29 years 2296
30 to 34 years 2336
35 to 39 years 2026
40 to 44 years 1905
45 to 49 years 2348
50 to 54 years 1853
55 to 59 years 1596
60 to 64 years 1249
65 to 69 years 1024
70 to 74 years 763
75 to 79 years 583
80 to 84 years 193
85 years and over 150

Race & Ethnicity

Racial/Ethnic Groups Percent
White 25669
Black or African American 633
American Indian and Alaska Native 38
Native Hawaiian and Other Pacific Islander 19
Some Other Race 345
Two or more races 1698