Reverse Phone Number Lookup in Illinois
Reverse phone lookup in Illinois lets you find the owner of any phone number using public records and government databases. Get the registered name and address in seconds. Perfect for Chicago residents and rural callers dealing with spam or unknown numbers. This number lookup helps Illinois residents screen calls and decide whether to answer, ignore, or block calls from unfamiliar numbers.
Reverse Phone Lookup by Illinois Area Code
All Illinois phone numbers consist of three parts: the three-digit Area Code,
the three-digit Prefix Code (also known as the exchange or central office code),
and the final four-digit line number. While the area code narrows down the
location to a large region, the prefix code can often specify the original city
or town where the number was registered.

Here's a complete list of Illinois area codes:
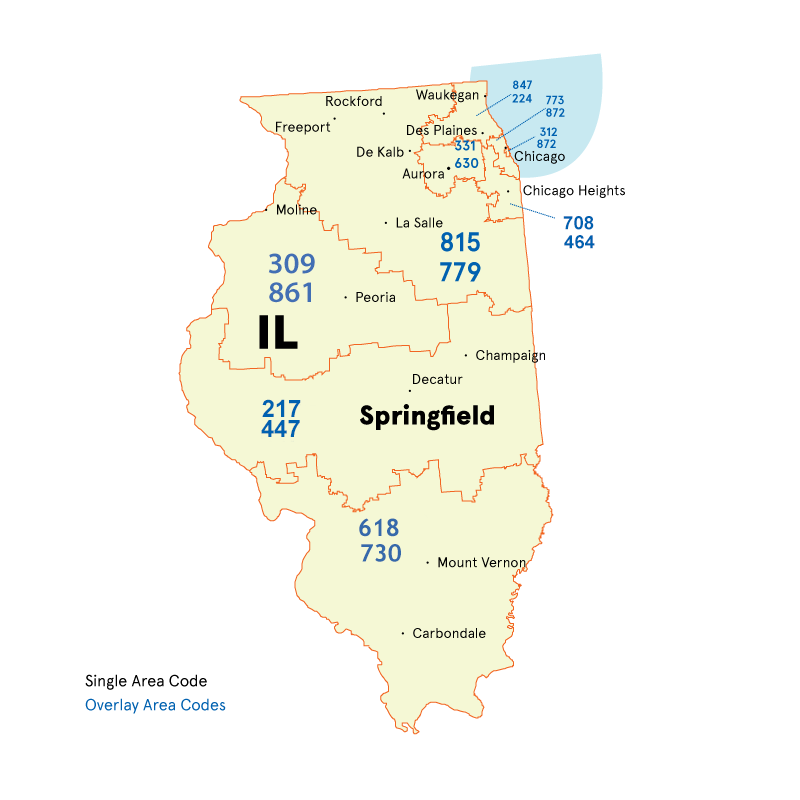
Area Codes 217/447: Springfield, Champaign, Decatur
Location: The 217 and 447 area codes cover central and southeastern Illinois, including major cities like Springfield, Champaign, and Decatur.
Common Callers: Illinois State government agencies, UI Urbana-Champaign admissions, and ADM commodity brokers.
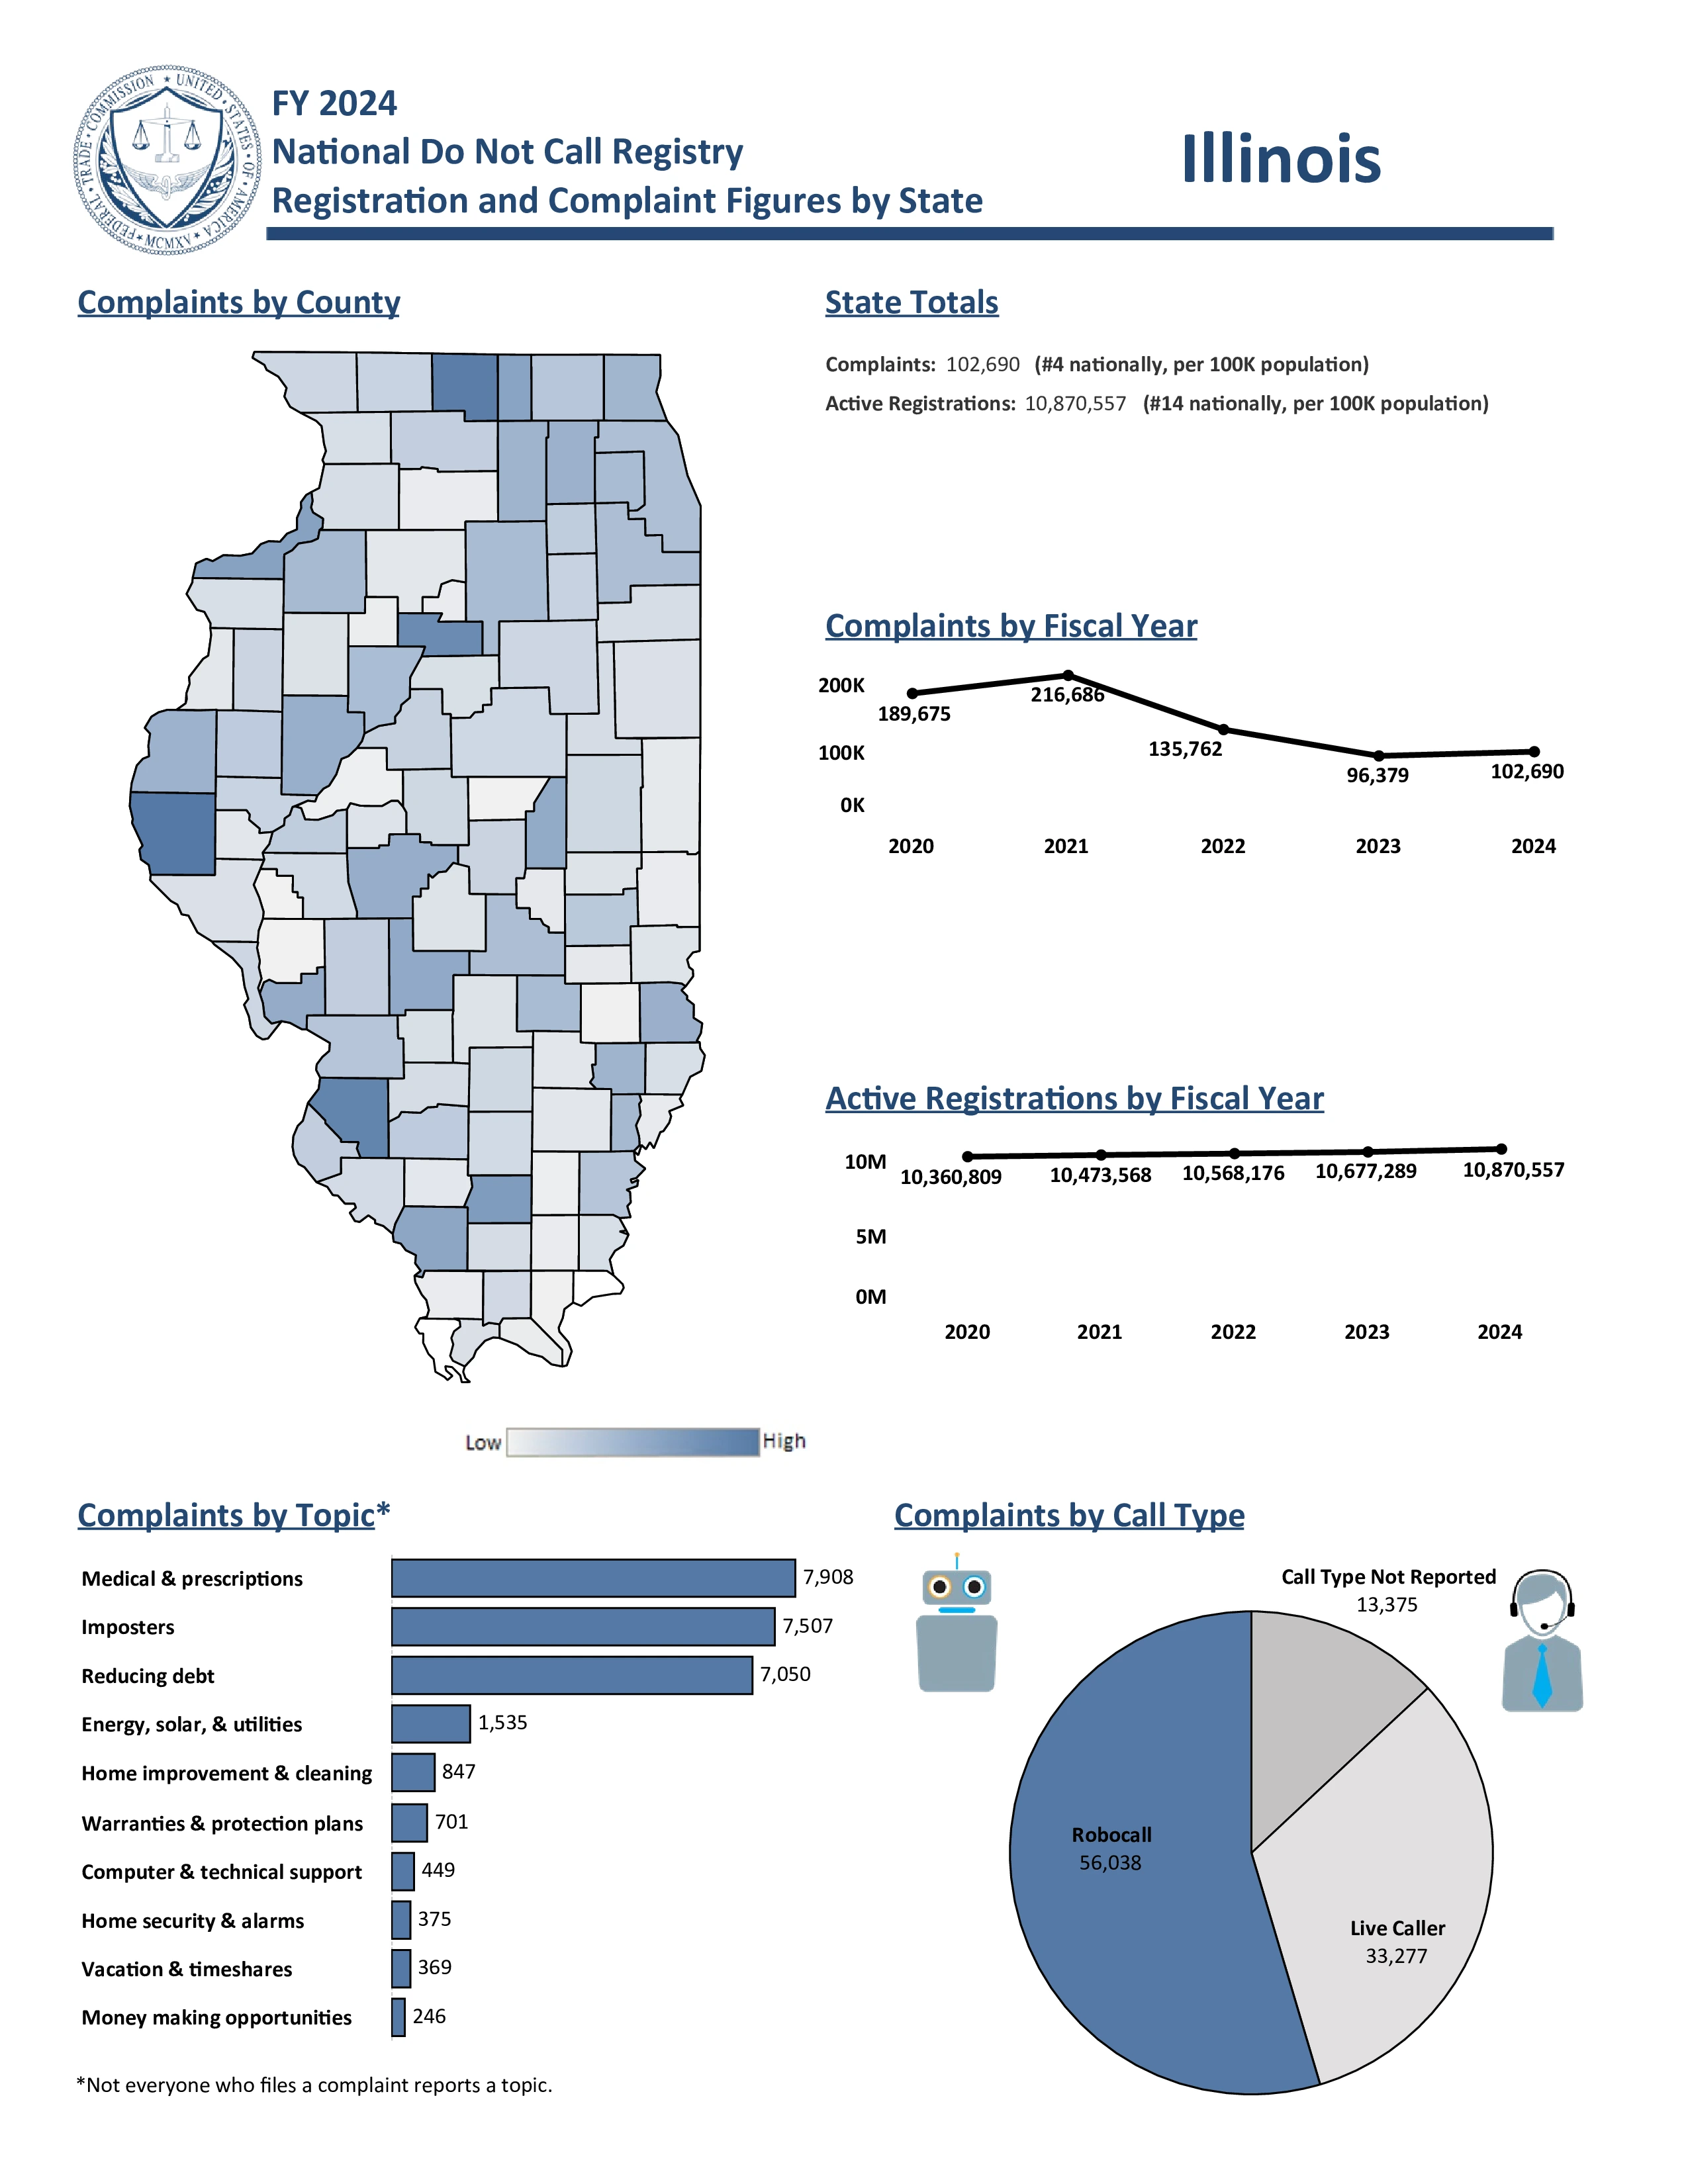
Scams and Spam Calls: The 217 and 447 area codes experience a high volume of "Final Notice" Vehicle Warranty calls and Fake Legal Action threats. Scammers in this region frequently use "Can You Hear Me?" voice phishing techniques, alongside Phishing Texts masquerading as delivery confirmations or orders.
Area Codes 224/847: Elgin, Waukegan, Arlington Heights
Location: The 224 and 847 area codes cover the northern suburbs of Chicago in Illinois, including major cities like Evanston, Schaumburg, and Waukegan.
Common Callers: Allstate insurance agents, Walgreens corporate support, AbbVie pharma sales, and Naval Station Great Lakes admin.
Scams and Spam Calls: The 224 and 847 area codes are subject to Aggressive Debt Collection scams and Social Security Number suspension threats. 847 specifically reports Chase Bank debt collection impersonators, while 224 is dealing with frequent Fake Warrant threats and Student Loan Forgiveness schemes.
Area Codes 309/861: Peoria, Bloomington, Normal
Location: The 309 and 861 area codes cover west-central Illinois, including major cities like Peoria, Moline, and Bloomington.
Common Callers: State Farm insurance claims adjusters, Caterpillar logistics, and John Deere equipment support.
Scams and Spam Calls: The 309 and 861 area codes are targeted by the specific "Megan's Student Loan Forgiveness" scam and Illinois DOT Driver's License text phishing. Residents also report PSE&G Rate Reduction scams (in 861) and Fake Car Accident/Debt Collection calls throughout the region.
Area Codes 312/872: Chicago
Location: The 312 and 872 area codes cover the central business district of Chicago (the Loop) in Illinois.
Common Callers: Chicago City Hall clerks, commodity traders (CME Group), and corporate lawyers.
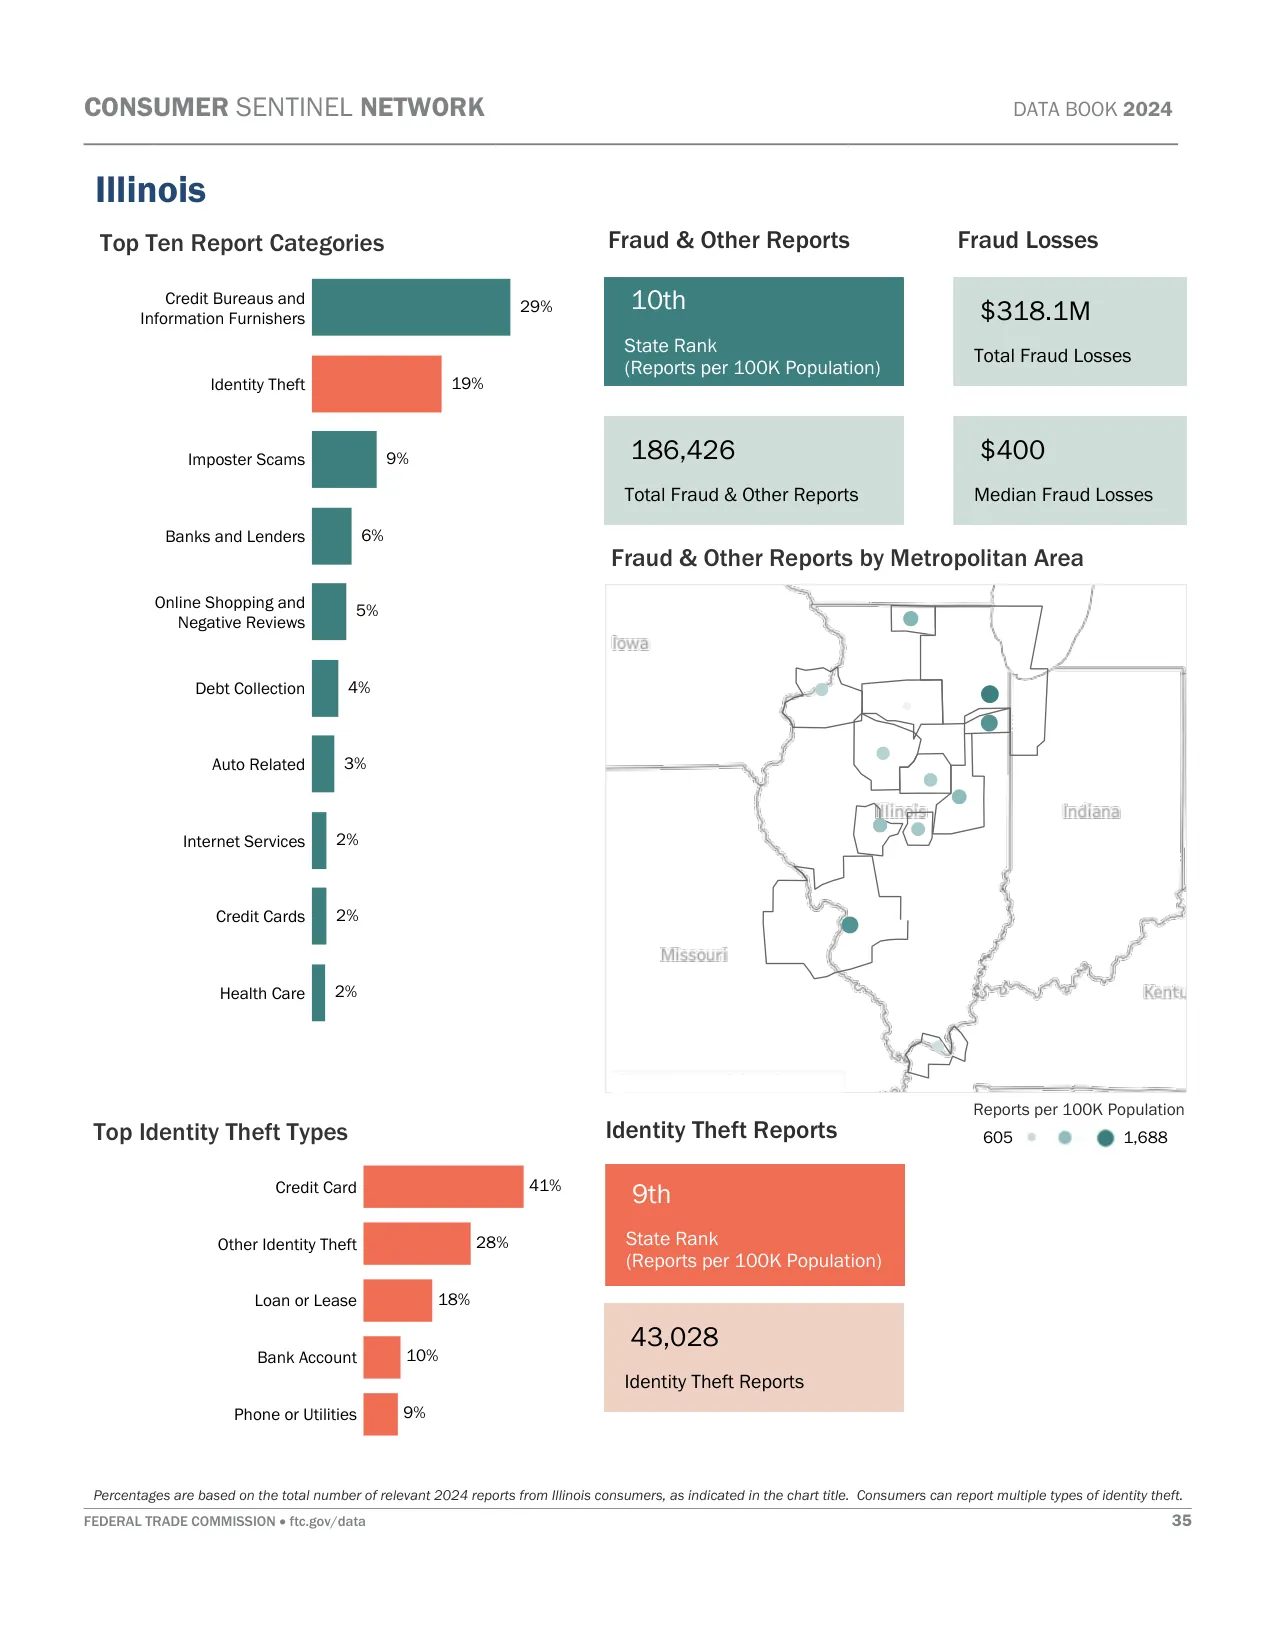
Scams and Spam Calls: The 312 and 872 area codes face threats from IRS Arrest Warrant scams and aggressive Law Enforcement Impersonation. 312 is dealing with specific Grubhub Delivery Fraud and Subscription Auto-Renewal scams, while 872 reports Bank Phishing text scams regarding locked cards and fraudulent Police Charity offers.
Area Codes 331/630: Aurora, Naperville, Bolingbrook
Location: The 331 and 630 area codes cover the western suburbs of Chicago in Illinois, including major cities like Aurora, Naperville, and Elgin.
Common Callers: The Joint Commission surveyors, Fermilab researchers, and Edward-Elmhurst Health schedulers.
Scams and Spam Calls: The 331 and 630 area codes are targeted by Fake Legal Complaints and HR Threats. Scammers frequently use "Can You Hear Me?" voice signature scams, Anonymous Medical/Health Surveys, and impersonate major utilities or brands like Amazon to solicit payments or personal data.
Area Codes 464/708: Cicero, Orland Park, Berwyn
Location: The 464 and 708 area codes cover the southern and western suburbs of Chicago in Illinois, including major cities like Cicero, Oak Lawn, and Tinley Park.
Common Callers: Advocate Christ Medical Center nurses, Loyola Medicine billing, and regional manufacturing sales.
Scams and Spam Calls: The 464 and 708 area codes experience frequent Fake Debt Collector and Process Server threats. Residents report Aggressive Utility Bill scams, Social Security & IRS impersonation, and specific "Can You Hear Me?" voice signature attempts.
Area Codes 618/730: Belleville, Granite City, O'Fallon
Location: The 618 and 730 area codes cover southern Illinois, including major cities like East St. Louis, Carbondale, and Belleville.
Common Callers: Scott Air Force Base (transportation command), SIU Carbondale alumni, and energy sector dispatchers.
Scams and Spam Calls: The 618 and 730 area codes are targeted by aggressive Medicare and "Health IQ" sales scams. Common issues include Fake Amazon & Apple purchase confirmations, abusive 401k & Retirement Plan telemarketing, and Fake Lawsuit/Document Service threats.
Area Codes 773/872: Chicago
Location: The 773 and 872 area codes cover the city of Chicago, excluding the central business district.
Common Callers: United Airlines operations (O'Hare), University of Chicago Health scheduling, and Chicago Cubs ticketing.
Scams and Spam Calls: Residents in the 773 and 872 area codes are bombarded by Fake Government Arrest Warrants (IRS/SSA) and Bogus Lawsuit threats. Specific local scams include Fifth Third Bank impersonation, Microsoft Windows Tech Support fraud, and Fake Loan/Cash Advance offers.
Area Codes 779/815: Rockford, Joliet, DeKalb
Location: The 779 and 815 area codes cover northern Illinois, outside the immediate Chicago metropolitan area, including major cities like Rockford, Joliet, and Peoria.
Common Callers: Amazon fulfillment center recruiters, ComEd/Exelon nuclear plant admin, and NIU admissions.
Scams and Spam Calls: The 779 and 815 area codes see frequent CEO & Coworker Impersonation scams and Illinois Secretary of State phishing texts. Residents also report Mortgage Foreclosure scams (specifically the "Alex Parker" script), Fake Loan offers, and aggressive Brand Impersonation involving Amazon and Microsoft.
Area Codes 312/773/872: Chicago
Location: The 312, 773, and 872 area codes cover the city of Chicago in Illinois, including the central business district and all surrounding city neighborhoods.
Common Callers: Cook County Government, Rush University Medical Center, DePaul University, Boeing (regional offices), and Chicago Transit Authority (CTA).
Scams and Spam Calls: Across the 312, 773, and 872 area codes, there is a heavy prevalence of Law Enforcement and IRS Impersonation scams threatening arrest. Residents frequently encounter Subscription Auto-Renewal traps, Fake Delivery/Grubhub fraud, and sophisticated Bank Phishing via text message.
Important: Area codes show where a number was originally assigned, not where the caller currently lives. Federal number portability laws
allow people to keep their phone numbers when moving or switching carriers. Use our reverse phone lookup tool above to get detailed phone number owner information.
For latest Illinois phone numbering regulations, contact George Light at the Illinois CC via [email protected] or 312-814-8591.
Illinois Phone Numbers
Illinois has approximately 18.3 million active phone numbers. Cell phones are the dominant type with 15.1 million users, while landlines have declined to 552,000 connections statewide. Internet phone services account for about 2.6 million numbers.
The vast majority of phone numbers in Illinois are mobile phones. This means tracing phone numbers can be more complex compared to traditional landlines due to decreased availability of public information.
Illinois Voice Subscriptions (in thousands):
| Service Type |
June 2023 |
Dec 2023 |
June 2024 |
| Mobile telephony |
14,822 |
15,057 |
15,106 |
| Local exchange telephone service |
729 |
671 |
552 |
| VoIP subscriptions |
2,715 |
2,625 |
2,593 |
| Total |
18,266 |
18,353 |
18,251 |
Source: FCC Voice Telephone Services Report
Top 5 US Cell Phone Companies
Most phone numbers are cell phones, and most cell phone numbers come from the top three United States wireless companies. Here are the top five US Cell Phone Companies in Q1 2025:
- Verizon - 146 million customers
- T-Mobile US - 131 million customers
- AT&T Mobility - 118 million customers
- Boost Mobile - 7 million customers
- U.S. Cellular - 4.4 million customers


