Reverse Phone Number Lookup in Georgia
A reverse phone lookup in Georgia lets you discover the name and address registered to any phone number through public databases from government sources. If you're asking "who called me from this phone number," this reverse search provides fast, accurate results. Whether it's a potential scam or someone you know, this tool gives Georgia residents clarity and helps avoid unwanted calls.
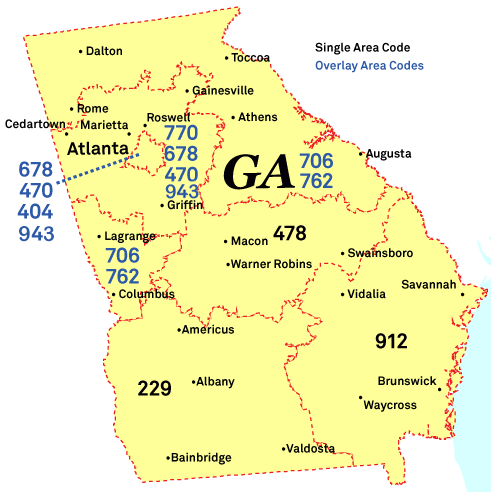
Reverse Phone Lookup by Georgia Area Code
All Georgia phone numbers consist of three parts: the three-digit Area Code,
the three-digit Prefix Code (also known as the exchange or central office code),
and the final four-digit line number. While the area code narrows down the
location to a large region, the prefix code can often specify the original city
or town where the number was registered.

Here's a complete list of Georgia area codes:
Area Code 229: Albany, Valdosta, Thomasville
Location: The 229 area code covers southwestern Georgia, including major cities like Albany, Valdosta, and Thomasville.
Common Callers: Marine Corps Logistics Base admin, poultry processing plant HR (Sanderson Farms), and Phoebe Putney Health staff.
Scams and Spam Calls: The 229 area code is targeted by scammers using Government Impersonation tactics (Social Security/Government grants) and High-Volume Health & Medicare robocalls. Specific local threats include Fake Job Offers, "Grandparent in Jail" emergency scams, and fraudulent offers for Police & Firefighter donations.
Area Codes 404/470/678/943: Atlanta, Sandy Springs
Location: The 404, 470, 678, and 943 area codes cover the greater Atlanta metropolitan area in Georgia, including major cities like Atlanta, Sandy Springs, and Roswell.
Common Callers: Delta Air Lines flight crew scheduling, CDC health alerts, Georgia Tech admissions, and Coca-Cola corporate.
Scams and Spam Calls: The 404, 470, 678, and 943 area codes are heavily targeted by Fake Process Server and Legal Action threats (including the specific "Luis Rossi" business contract scam in 678). Residents across this complex frequently report "Cash for Your Home" offers, Student Loan Forgiveness schemes, and aggressive impersonation of brands like Amazon, Apple, and the Social Security Administration.
Area Codes 404/470/678/770/943: Atlanta, Sandy Springs, Roswell
Location: The 404, 470, 678, 770, and 943 area codes cover the greater Atlanta metropolitan area in Georgia, including major cities like Atlanta, Marietta, and Sandy Springs.
Common Callers: The Home Depot (HQ), UPS (HQ), Wellstar Health System, Cobb County School District, and Lockheed Martin Aeronautics (Marietta).
Scams and Spam Calls: Across the 404, 470, 678, 770, and 943 area codes, scammers utilize aggressive Fake Legal Action and Wage Garnishment threats. The 770 area code specifically adds a high volume of Fake UPS/Amazon Delivery scams and constant "Charity Pickup" robocalls to the mix, alongside the widespread Vehicle Warranty and Social Security impersonation calls found throughout the complex.
Area Code 478: Macon, Warner Robins, Milledgeville
Location: The 478 area code covers central Georgia, including major cities like Macon, Warner Robins, and Milledgeville.
Common Callers: Robins Air Force Base personnel, Mercer University alumni, and Atrium Health Navicent billing.
Scams and Spam Calls: The 478 area code experiences frequent "Boss Needs Gift Cards" text scams (smishing) targeting employees. Residents also report Phony Debt Collector threats, Fake Publishers Clearing House prize notifications, and standard Vehicle Extended Warranty robocalls.
Area Codes 706/762: Augusta, Columbus, Athens
Location: The 706 and 762 area codes cover northern and eastern Georgia, including major cities like Augusta, Columbus, and Athens.
Common Callers: University of Georgia fundraising, Aflac claims specialists, and Fort Eisenhower (Cyber Command) staff.
Scams and Spam Calls: The 706 and 762 area codes are subject to persistent Social Security Administration imposters and Fake Legal Action threats. Scammers in this region heavily utilize Refund and Subscription scams (impersonating Amazon or travel agencies) and DirecTV Discount impersonations, alongside Publishers Clearing House lottery schemes.
Area Codes 470/678/770/943: Roswell, Johns Creek, Alpharetta
Location: The 470, 678, 770, and 943 area codes cover the suburbs and surrounding areas of Atlanta in northern Georgia, including major cities like Marietta, Sandy Springs, and Roswell.
Common Callers: Lockheed Martin Aeronautics (Marietta), The Home Depot (Store Support Center), UPS (Global HQ), Wellstar Health System, Northside Hospital, Mercedes-Benz USA, and Kennesaw State University.
Scams and Spam Calls: Residents in the 470, 678, 770, and 943 area codes report a deluge of Student Loan Forgiveness scams and Persistent Auto Warranty robocalls. Specific threats include "Computer Tech Support Lockdown" pop-ups and calls, Suspicious Employment Verification phishing, and impersonations of medical supply companies targeting Medicare recipients.
Area Code 912: Savannah, Hinesville, Statesboro
Location: The 912 area code covers southeastern Georgia, including major cities like Savannah, Hinesville, and Brunswick.
Common Callers: Gulfstream Aerospace recruiters, Georgia Ports Authority logistics, and Fort Stewart housing offices.
Scams and Spam Calls: The 912 area code is dealing with a concentration of Government Impersonation scams involving the IRS, Treasury, and Social Security Administration. Residents are frequently harassed by Fake Process Server threats, fraudulent Student Loan Forgiveness offers, and Utility Shut-Off threats designed to panic homeowners.
Important: Area codes show where a number was originally assigned, not where the caller currently lives. Federal number portability laws
allow people to keep their phone numbers when moving or switching carriers. Use our reverse phone lookup tool above to get detailed phone number owner information.
For latest Georgia phone numbering regulations, contact Erica Wilson at the Georgia PSC via [email protected] or 404-651-9402.
Georgia Phone Numbers
Georgia has approximately 15.1 million active phone numbers. Cell phones account for the majority with 12.7 million users, while traditional landlines are declining with just 503,000 connections statewide. Internet phone services account for about 1.9 million numbers.
This means that when you search a Georgia phone number, it's most likely a cell phone. The shift away from landlines means newer phone numbers are typically harder to trace than older landline numbers that had more public information available.
Georgia Voice Subscriptions (in thousands):
| Service Type |
June 2023 |
Dec 2023 |
June 2024 |
| Mobile telephony |
12,400 |
12,594 |
12,689 |
| Local exchange telephone service |
655 |
605 |
503 |
| VoIP subscriptions |
2,002 |
1,962 |
1,924 |
| Total |
15,057 |
15,161 |
15,116 |
Source: FCC Voice Telephone Services Report
Top 5 US Cell Phone Companies
Most phone numbers are cell phones, and most cell phone numbers come from the top three United States wireless companies. Here are the top five US Cell Phone Companies in Q1 2025:
- Verizon - 146 million customers
- T-Mobile US - 131 million customers
- AT&T Mobility - 118 million customers
- Boost Mobile - 7 million customers
- U.S. Cellular - 4.4 million customers


