Ladson Phone Book
Public Schools
Hotels and Motels
Alternative Fuel Stations
Fire Departments
Ladson Reverse Phone Lookup
Browse Chicago phone numbers by rate center and prefix.
Ladson Phone Numbers
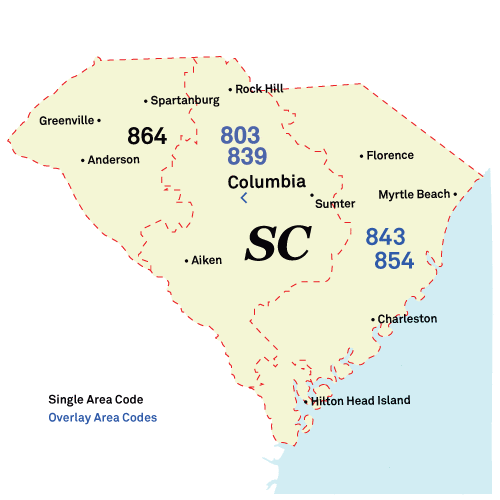
Rate Center: Summerville (SUMMERVL)
Phone numbers with the Summerville rate center prefixes:
- Phone Numbers 843-285-....
- Phone Numbers 843-376-....
- Phone Numbers 843-486-....
- Phone Numbers 843-695-....
- Phone Numbers 843-771-....
- Phone Numbers 843-821-....
- Phone Numbers 843-832-....
- Phone Numbers 843-851-....
- Phone Numbers 843-871-....
- Phone Numbers 843-873-....
- Phone Numbers 843-875-....
- Phone Numbers 843-879-....
- Phone Numbers 843-900-....
- Phone Numbers 843-970-....
Illinois City Phone Books
- Charleston, SC Phone Book
- Columbia, SC Phone Book
- North Charleston, SC Phone Book
- Mount Pleasant, SC Phone Book
- Rock Hill, SC Phone Book
- Greenville, SC Phone Book
- Summerville, SC Phone Book
- Goose Creek, SC Phone Book
- Hilton Head Island, SC Phone Book
- Sumter, SC Phone Book
- Florence, SC Phone Book
- Spartanburg, SC Phone Book
- Myrtle Beach, SC Phone Book
- Greer, SC Phone Book
- Aiken, SC Phone Book
- Anderson, SC Phone Book
- Conway, SC Phone Book
- North Augusta, SC Phone Book
- Greenwood, SC Phone Book
- Simpsonville, SC Phone Book
- Bluffton, SC Phone Book
- Taylors, SC Phone Book
- Lexington, SC Phone Book
- Easley, SC Phone Book
- Fort Mill, SC Phone Book
- West Columbia, SC Phone Book
- Clemson, SC Phone Book
- North Myrtle Beach, SC Phone Book
- Ladson, SC Phone Book
- Cayce, SC Phone Book
- Beaufort, SC Phone Book
- Gaffney, SC Phone Book
- Orangeburg, SC Phone Book
- Irmo, SC Phone Book
- Moncks Corner, SC Phone Book
- Newberry, SC Phone Book
- Boiling Springs, SC Phone Book
- Little River, SC Phone Book
- Lancaster, SC Phone Book
- Lugoff, SC Phone Book
- Georgetown, SC Phone Book
- Laurens, SC Phone Book
- Seneca, SC Phone Book
- Clinton, SC Phone Book
- York, SC Phone Book
- Travelers Rest, SC Phone Book
- Bennettsville, SC Phone Book
- Union, SC Phone Book
- Hartsville, SC Phone Book
- Camden, SC Phone Book
- Hardeeville, SC Phone Book
- Marion, SC Phone Book
- Lake City, SC Phone Book
- Clover, SC Phone Book
- Dillon, SC Phone Book
- Piedmont, SC Phone Book
- Darlington, SC Phone Book
- Cheraw, SC Phone Book
- Walterboro, SC Phone Book
- Chester, SC Phone Book
- Abbeville, SC Phone Book
- Edgefield, SC Phone Book
- Walhalla, SC Phone Book
- Barnwell, SC Phone Book
- Mullins, SC Phone Book
- Williamston, SC Phone Book
- Manning, SC Phone Book
- Ridgeland, SC Phone Book
- Inman, SC Phone Book
- Blythewood, SC Phone Book
- Saluda, SC Phone Book
- Duncan, SC Phone Book
- Pendleton, SC Phone Book
- Denmark, SC Phone Book
- Winnsboro, SC Phone Book
- Pickens, SC Phone Book
- Kingstree, SC Phone Book
- McCormick, SC Phone Book
- Bishopville, SC Phone Book
- Westminster, SC Phone Book
- Blacksburg, SC Phone Book
- Blackville, SC Phone Book
- Kershaw, SC Phone Book
- Chapin, SC Phone Book
- Latta, SC Phone Book
- Santee, SC Phone Book
- Yemassee, SC Phone Book
- Summerton, SC Phone Book
- Swansea, SC Phone Book
- Chesnee, SC Phone Book
- Hemingway, SC Phone Book
- Richburg, SC Phone Book
- Pawleys Island, SC Phone Book
- Johns Island, SC Phone Book
Local Time in Ladson, SC
Local Time
01:03 AM
Date
Sunday, May 19, 2024
Time Zone
EDT
Ladson, SC Population
Chicago has a population of 15252 people. Sex ratio is 114.00 males per 100 females.
Population by Age
The median age in Chicago is 34.8 years.
| Age Groups | Population |
|---|---|
| Under 5 years | 863 |
| 5 to 9 years | 2211 |
| 10 to 14 years | 1184 |
| 15 to 19 years | 1178 |
| 20 to 24 years | 670 |
| 25 to 29 years | 836 |
| 30 to 34 years | 929 |
| 35 to 39 years | 1077 |
| 40 to 44 years | 914 |
| 45 to 49 years | 896 |
| 50 to 54 years | 1244 |
| 55 to 59 years | 616 |
| 60 to 64 years | 847 |
| 65 to 69 years | 459 |
| 70 to 74 years | 509 |
| 75 to 79 years | 293 |
| 80 to 84 years | 352 |
| 85 years and over | 174 |
Race & Ethnicity
| Racial/Ethnic Groups | Percent |
|---|---|
| White | 7930 |
| Black or African American | 4102 |
| American Indian and Alaska Native | 177 |
| Native Hawaiian and Other Pacific Islander | 9 |
| Some Other Race | 1437 |
| Two or more races | 1482 |
