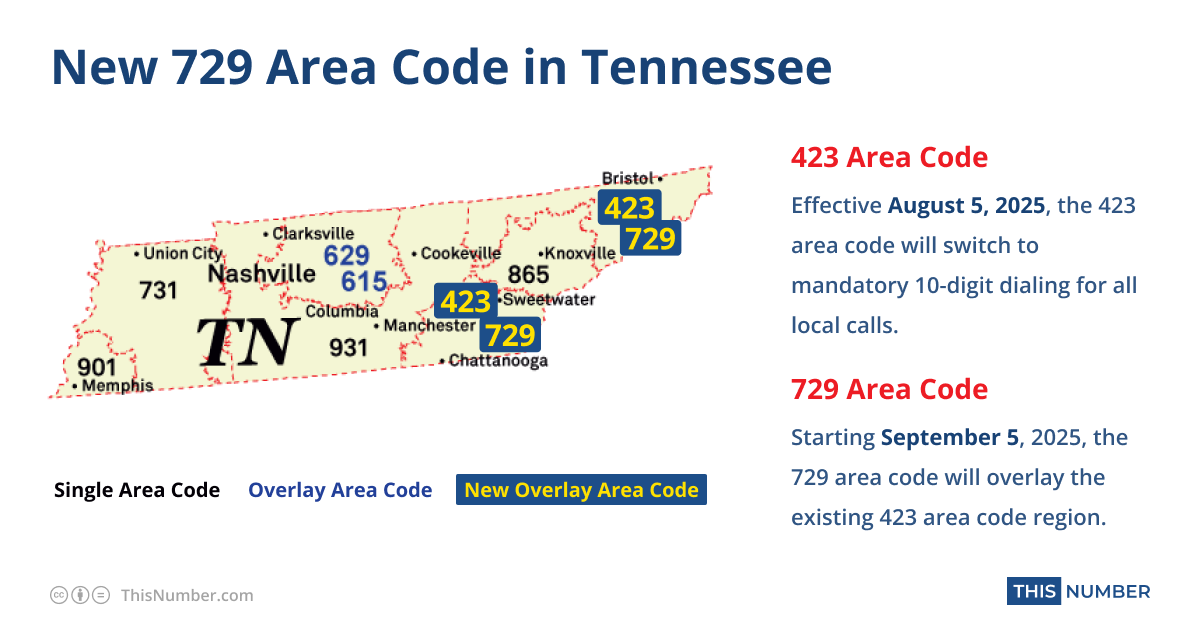
Important: Beginning August 5, 2025, 10-digit dialing will be required for local calls in the 423 area code region of Tennessee. A
new 729 area code will also begin to be issued in the same area starting September 5, 2025. This change won’t affect your current number, but you’ll need to dial the area code for all local calls. Be sure to update contact lists, devices, and materials accordingly. Check with your phone provider for additional guidance.
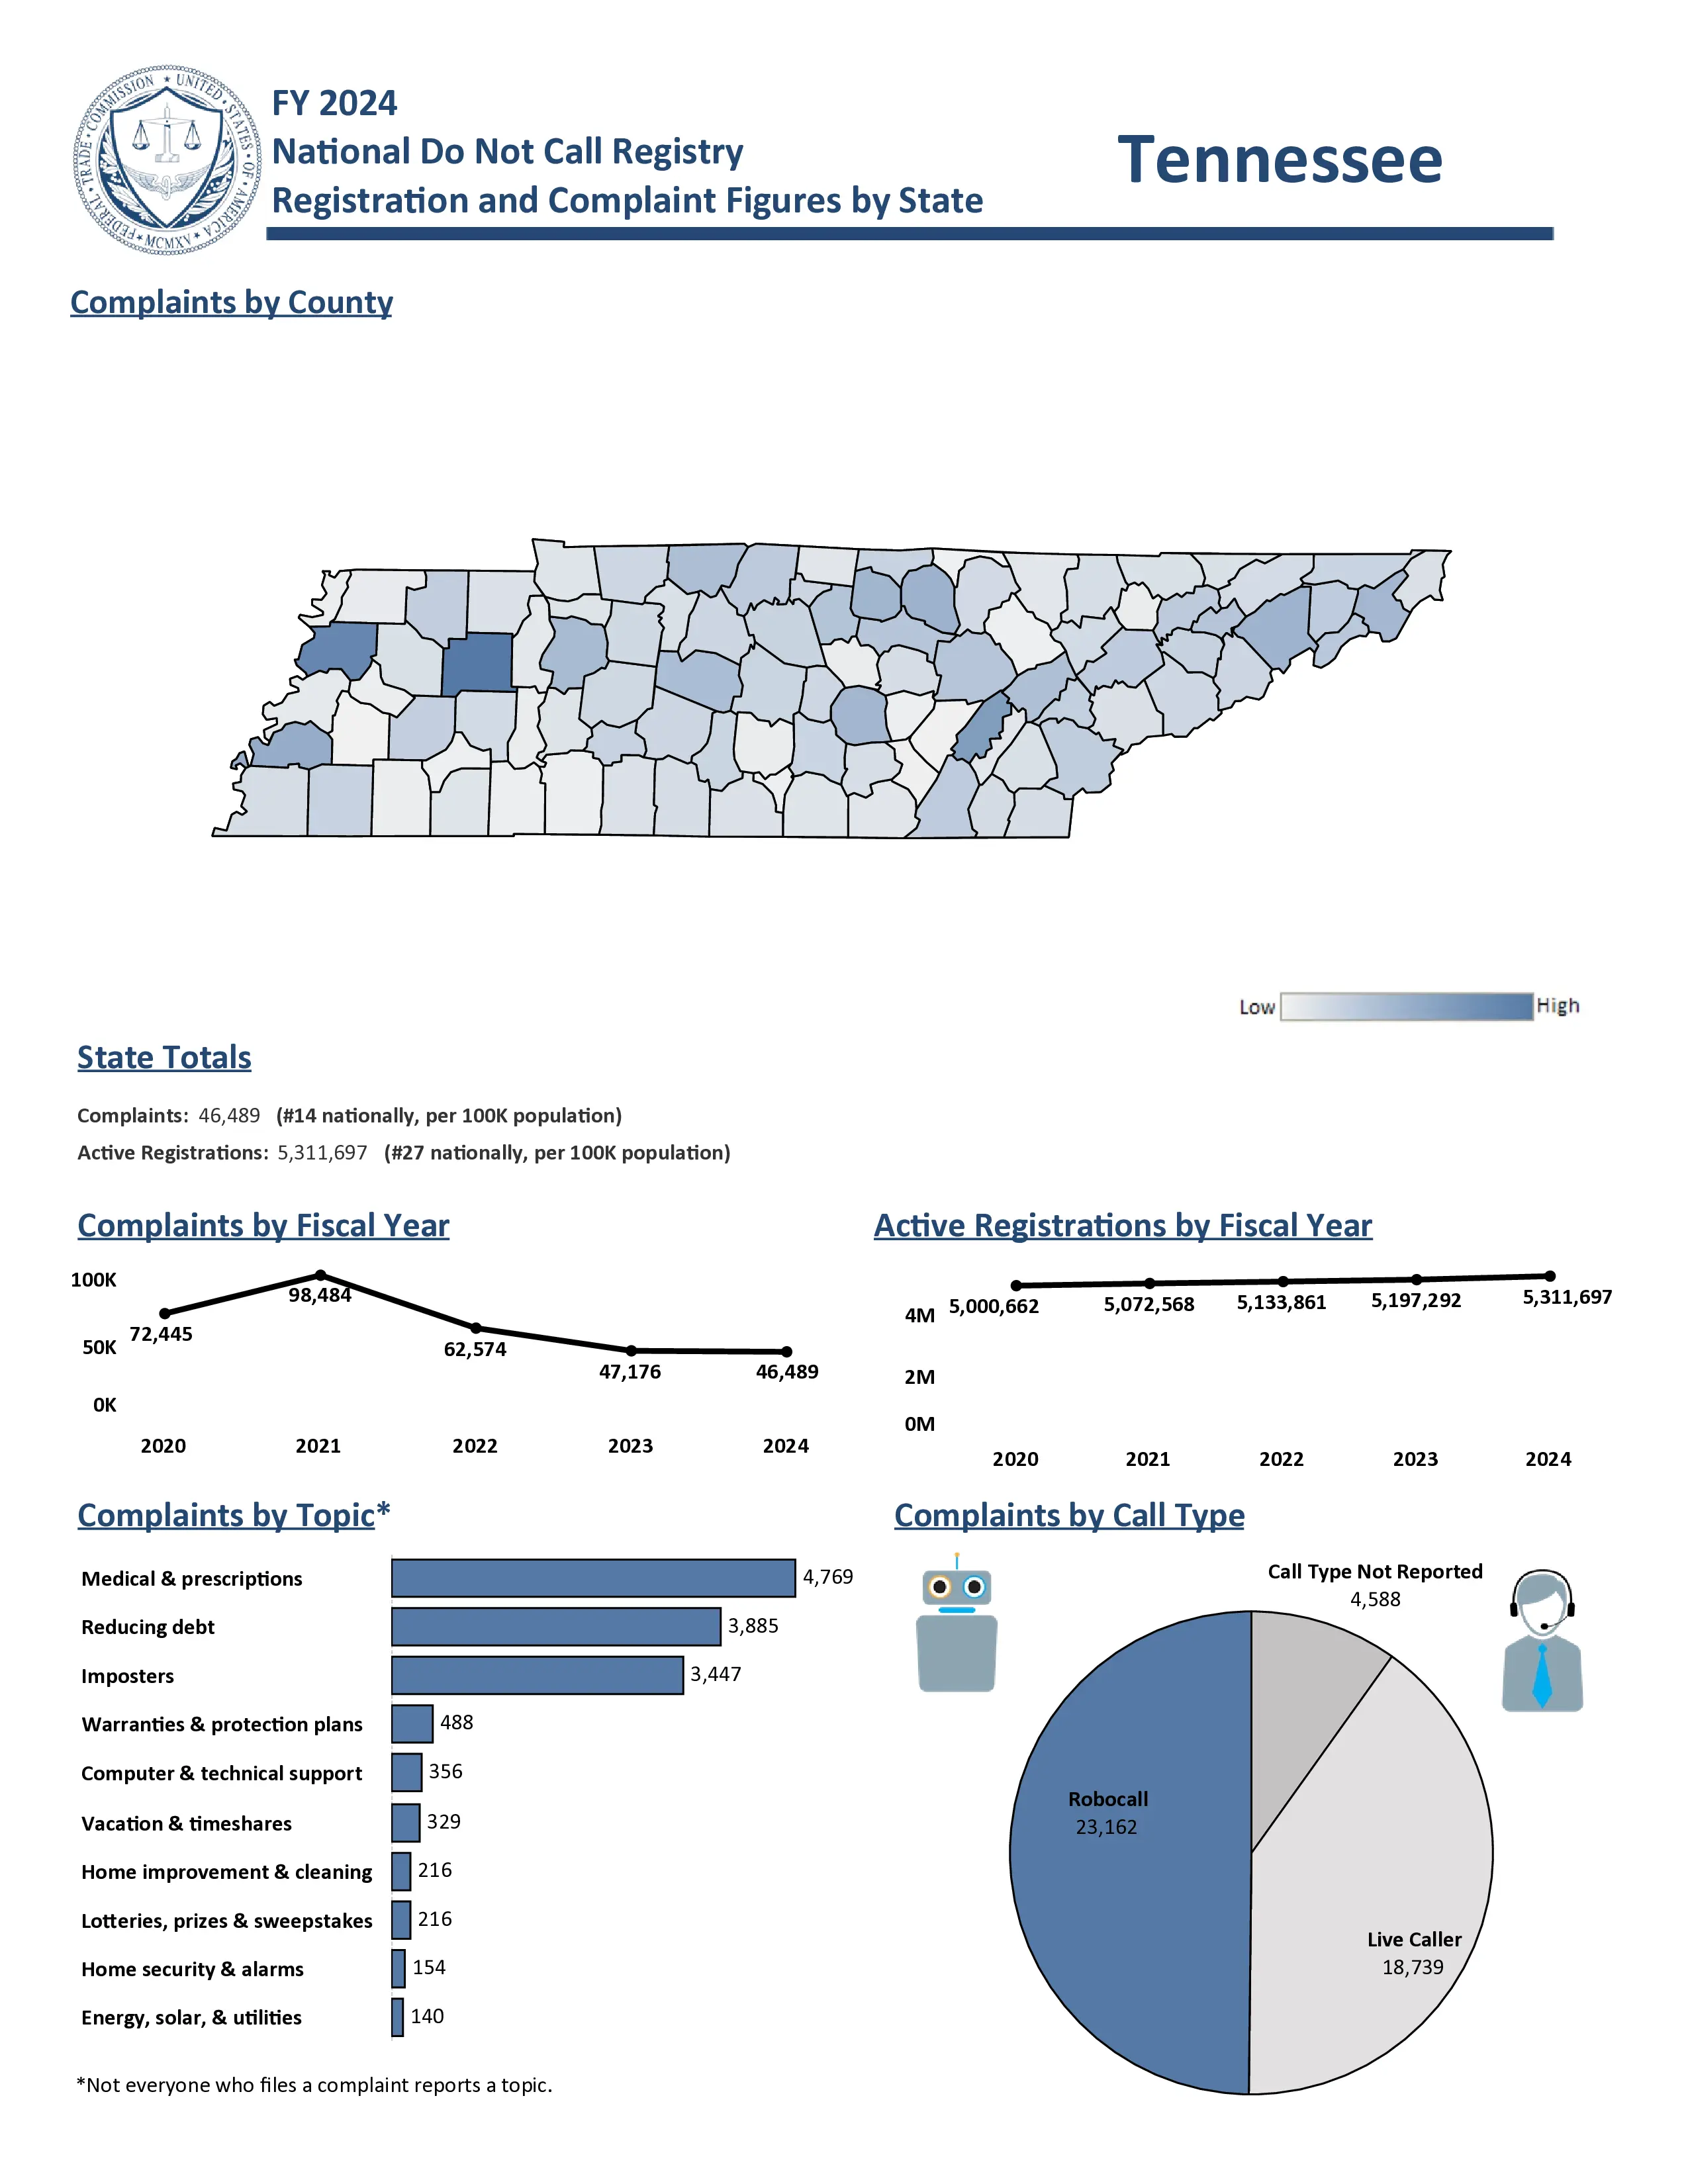
Reverse Phone Number Lookup in Tennessee
Tennessee has approximately 9.5 million active phone numbers. Mobile phone subscriptions dominate, accounting for nearly 8 million connections. Traditional landlines are declining, with only about 330,000 lines remaining. Internet-based phone services (VoIP) are growing in popularity, with around 1.3 million subscriptions.
When tracing a phone number in Tennessee, it's highly probable that it's a mobile phone. Due to the decline of landlines, obtaining information from newer phone numbers can be more challenging as landlines traditionally had more publicly accessible data.
Tennessee Voice Subscriptions (in thousands):
| Service Type |
June 2023 |
Dec 2023 |
June 2024 |
| Mobile telephony |
7,760 |
7,853 |
7,931 |
| Local exchange telephone service |
412 |
381 |
330 |
| VoIP subscriptions |
1,226 |
1,246 |
1,287 |
| Total |
9,398 |
9,480 |
9,548 |
Source: FCC Voice Telephone Services Report
Top 5 US Cell Phone Companies
Most phone numbers are cell phones, and most cell phone numbers come from the top three United States wireless companies. Here are the top five US Cell Phone Companies in Q1 2025:
- Verizon - 146 million customers
- T-Mobile US - 131 million customers
- AT&T Mobility - 118 million customers
- Boost Mobile - 7 million customers
- U.S. Cellular - 4.4 million customers
Tennessee Area Code Lookup
To identify the location of an Tennessee phone number, you need to understand the North American Numbering Plan (NANP) structure that all Tennessee numbers follow: +1 NPA NXX XXXX.
- +1 - Country code indicating the United States
- NPA - The area code reveals the geographic region where the number was originally assigned
- NXX - Central office code that locates the specific neighborhood and identifies the service provider
- XXXX - Subscriber number identifies the individual phone line within that local exchange
The area code (NPA) is your key to determining location. By matching the three-digit area code to Tennessee's regional assignments, you can identify which part of the state the phone number originates from. Each area code corresponds to specific cities and counties throughout Tennessee, making it possible to narrow down the caller's general location.
Here's a complete list of Tennessee area codes with major cities:
| Area Codes |
Cities |
| 423/729 | Chattanooga, Johnson City, Kingsport |
| 615/629 | Nashville, Murfreesboro, Franklin |
| 731 | Jackson, Dyersburg, Martin |
| 865 | Knoxville, Oak Ridge, Maryville |
| 901 | Memphis, Bartlett, Collierville |
| 931 | Clarksville, Columbia, Cookeville |
For latest Tennessee phone numbering regulations, contact John Hutton at the Tennessee RA via [email protected] or 615-419-3982.
Important: Area codes can only tell you where a phone number was originally assigned, not where the phone number owner currently lives. Due to number portability and mobile/VoIP services, the actual user location may be completely different today. For accurate owner information and current details, use our reverse phone lookup tool above.