Why People Use Reverse Phone Lookup in Garland
Got a phone call or message from a Garland, Texas phone number you don't recognize? Before you answer, call back, or reply, use our phone number lookup service to find out who's really on the other end, is it a scam, legitimate business or someone you'd rather avoid.
Identify Unknown Callers
The total population of Garland, TX, is 246,018. That's thousands of potential callers you might not recognize: local business contacts, neighbors, service providers, or people from across the city.
An unknown caller could be anyone — a sales call, an old friend, someone you actually want to talk to. Without caller identification, you either ignore potentially important calls or answer ones you'd rather avoid.
Research Potential Scam Calls
Scam and spam calls continue to impact TX residents which, according to the National Do Not Call Registry Data Book, filed 170,483 complaints about unwanted calls in 2024. Of these, 91,857 were robocalls and 62,262 involved live callers. The top complaint topics included medical and prescriptions (17,061), imposters (13,964), reducing debt (11,621).
According to FTC 2024 data, TX residents reported 162,101 fraud cases in 2024, resulting in $897,890,888 in losses, with a median loss of $500 per victim. Given that more than 1 in 3 fraud attempts occur over the phone, verifying who is calling is critical for preventing financial losses.
How to report a fraudulent call in Garland?
If you receive fraudulent calls or suspect a scam attempt, report it to reportfraud.ftc.gov or local police department using the following contacts:
Garland Police Department
1891 Forest Lane, Garland, TX 75042-7915
(972) 205-2011
Additionally, protect your household by registering your phone numbers at donotcall.gov or by calling 1-888-382-1222 from the number you wish to register.
Verify Texas Businesses
Have you received a call from a business but aren’t sure if it’s really them?
Garland is primarily located in Dallas County, which, according to U.S. Census Bureau data, includes 56,788 firms and 70,472 establishments employing 1,587,323 people.
| County |
Percent of City |
Firms |
Establishments |
| Dallas |
99.90% |
56788 |
70472 |
| Collin |
0.10% |
25076 |
29742 |
Use our service to reverse-lookup unknown Texas phone numbers to verify whether they actually belong to a company before answering or calling back. By cross-referencing phone numbers with local business directories, you can ensure you’re dealing with legitimate local businesses, services, contractors, or vendors—not scammers spoofing local numbers to gain your trust.
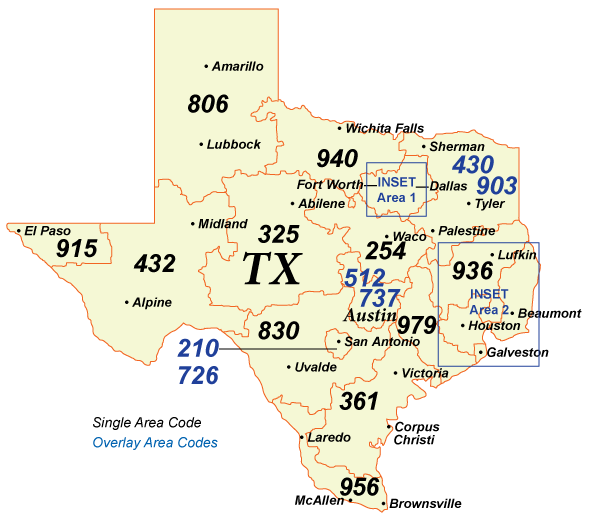
Garland Area Code and Phone Number Format
Garland area codes are
214, 469, 972. Phone numbers in Texas follow the following structure under the North American Numbering Plan:
-
- Texas area code (where the number was originally assigned)
- NXX - Central office code that locates the specific neighborhood and identifies the service provider
- XXXX - Subscriber number identifies the individual phone line within that local exchange
Understanding the area code can help you determine if a call is local to your area. However, keep in mind that due to mobile number portability and VoIP services, the caller may be anywhere in the United States, so it’s best to search for the most recent phone number details.
Texas Area Codes Map
Phone Number Search in Other Texas Cities
-
Houston, TX
-
San Antonio, TX
-
Dallas, TX
-
Austin, TX
-
Fort Worth, TX
-
El Paso, TX
-
Arlington, TX
-
Corpus Christi, TX
-
Plano, TX
-
Laredo, TX
-
Lubbock, TX
-
Irving, TX
-
Garland, TX
-
Amarillo, TX
-
Grand Prairie, TX
-
McKinney, TX
-
Frisco, TX
-
Brownsville, TX
-
Pasadena, TX
-
Killeen, TX
-
McAllen, TX
-
Mesquite, TX
-
Midland, TX
-
Denton, TX
-
Waco, TX
-
Carrollton, TX
-
Round Rock, TX
-
Pearland, TX
-
Abilene, TX
-
Odessa, TX
-
Richardson, TX
-
Sugar Land, TX
-
Beaumont, TX
-
College Station, TX
-
The Woodlands, TX
-
Lewisville, TX
-
Tyler, TX
-
League City, TX
-
Wichita Falls, TX
-
Allen, TX
-
Edinburg, TX


