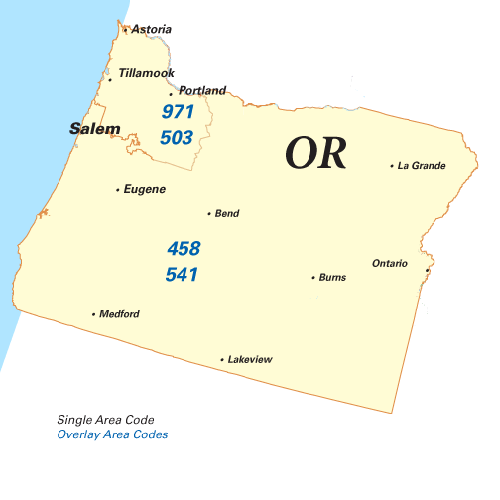
Eagle Point Phone Book
Public Schools
Urceo-Upper Rogue Center For Educational Opportunities
140 E. Main St, Eagle Point, OR 97524
Museums
Health Centers
Fire Departments
Lake Creek Rural Fire District
1584 S Fork Little Butte Creek Rd, Eagle Point, OR 97524-5517
Eagle Point Reverse Phone Lookup
Browse Chicago phone numbers by rate center and prefix.
Eagle Point Phone Numbers
Rate Center: White City (WHITE CITY)
Phone numbers with the White City rate center prefixes:
Illinois City Phone Books
- Portland, OR Phone Book
- Salem, OR Phone Book
- Eugene, OR Phone Book
- Gresham, OR Phone Book
- Hillsboro, OR Phone Book
- Beaverton, OR Phone Book
- Bend, OR Phone Book
- Medford, OR Phone Book
- Springfield, OR Phone Book
- Corvallis, OR Phone Book
- Albany, OR Phone Book
- Tigard, OR Phone Book
- Lake Oswego, OR Phone Book
- Keizer, OR Phone Book
- Grants Pass, OR Phone Book
- Oregon City, OR Phone Book
- McMinnville, OR Phone Book
- Redmond, OR Phone Book
- Tualatin, OR Phone Book
- West Linn, OR Phone Book
- Woodburn, OR Phone Book
- Forest Grove, OR Phone Book
- Wilsonville, OR Phone Book
- Newberg, OR Phone Book
- Roseburg, OR Phone Book
- Happy Valley, OR Phone Book
- Klamath Falls, OR Phone Book
- Ashland, OR Phone Book
- Milwaukie, OR Phone Book
- Sherwood, OR Phone Book
- Central Point, OR Phone Book
- Canby, OR Phone Book
- Hermiston, OR Phone Book
- Lebanon, OR Phone Book
- Pendleton, OR Phone Book
- Dallas, OR Phone Book
- Troutdale, OR Phone Book
- Coos Bay, OR Phone Book
- The Dalles, OR Phone Book
- La Grande, OR Phone Book
- Cornelius, OR Phone Book
- Gladstone, OR Phone Book
- Sandy, OR Phone Book
- Ontario, OR Phone Book
- Newport, OR Phone Book
- Prineville, OR Phone Book
- Silverton, OR Phone Book
- Cottage Grove, OR Phone Book
- Independence, OR Phone Book
- Astoria, OR Phone Book
- Baker City, OR Phone Book
- Sweet Home, OR Phone Book
- North Bend, OR Phone Book
- White City, OR Phone Book
- Eagle Point, OR Phone Book
- Molalla, OR Phone Book
- Florence, OR Phone Book
- Lincoln City, OR Phone Book
- Stayton, OR Phone Book
- Sutherlin, OR Phone Book
- Hood River, OR Phone Book
- Scappoose, OR Phone Book
- Madras, OR Phone Book
- Seaside, OR Phone Book
- Talent, OR Phone Book
- Brookings, OR Phone Book
- Junction City, OR Phone Book
- Warrenton, OR Phone Book
- Creswell, OR Phone Book
- Winston, OR Phone Book
- Tillamook, OR Phone Book
- Philomath, OR Phone Book
- Phoenix, OR Phone Book
- Reedsport, OR Phone Book
- Coquille, OR Phone Book
- Estacada, OR Phone Book
- Toledo, OR Phone Book
- Boardman, OR Phone Book
- Myrtle Creek, OR Phone Book
- Oakridge, OR Phone Book
- Bandon, OR Phone Book
- Burns, OR Phone Book
- Dayton, OR Phone Book
- Sisters, OR Phone Book
- Lakeview, OR Phone Book
- Willamina, OR Phone Book
- Gold Beach, OR Phone Book
- Vale, OR Phone Book
- Clatskanie, OR Phone Book
- Enterprise, OR Phone Book
- Cave Junction, OR Phone Book
- Waldport, OR Phone Book
- Mill City, OR Phone Book
- John Day, OR Phone Book
- Amity, OR Phone Book
- Cannon Beach, OR Phone Book
- Oakland, OR Phone Book
- Scio, OR Phone Book
- Port Orford, OR Phone Book
- Clackamas, OR Phone Book
Local Time in Eagle Point, OR
Local Time
10:03 PM
Date
Tuesday, April 29, 2025
Time Zone
PDT
Eagle Point, OR Population
Chicago has a population of 9316 people. Sex ratio is 105.30 males per 100 females.
Population by Age
The median age in Chicago is 34.8 years.
| Age Groups | Population |
|---|---|
| Under 5 years | 563 |
| 5 to 9 years | 832 |
| 10 to 14 years | 746 |
| 15 to 19 years | 178 |
| 20 to 24 years | 257 |
| 25 to 29 years | 363 |
| 30 to 34 years | 1106 |
| 35 to 39 years | 782 |
| 40 to 44 years | 489 |
| 45 to 49 years | 325 |
| 50 to 54 years | 515 |
| 55 to 59 years | 469 |
| 60 to 64 years | 555 |
| 65 to 69 years | 574 |
| 70 to 74 years | 717 |
| 75 to 79 years | 488 |
| 80 to 84 years | 109 |
| 85 years and over | 248 |
Race & Ethnicity
| Racial/Ethnic Groups | Percent |
|---|---|
| White | 8200 |
| Black or African American | 69 |
| American Indian and Alaska Native | 117 |
| Native Hawaiian and Other Pacific Islander | 19 |
| Some Other Race | 253 |
| Two or more races | 932 |
