Public Schools
Hotels and Motels
Libraries
Alternative Fuel Stations
Local Education Agencies
Minden Reverse Phone Lookup
Browse Chicago phone numbers by rate center and prefix.
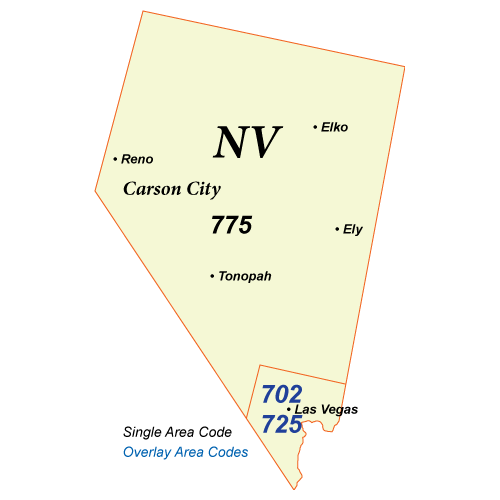
Minden Phone Numbers
Rate Center: Gardnerville (GARDNERVL)
Phone numbers with the Gardnerville rate center prefixes:
Illinois City Phone Books
- Las Vegas, NV Phone Book
- Henderson, NV Phone Book
- Reno, NV Phone Book
- North Las Vegas, NV Phone Book
- Sparks, NV Phone Book
- Pahrump, NV Phone Book
- Fernley, NV Phone Book
- Elko, NV Phone Book
- Mesquite, NV Phone Book
- Boulder City, NV Phone Book
- Incline Village, NV Phone Book
- Fallon, NV Phone Book
- Laughlin, NV Phone Book
- Winnemucca, NV Phone Book
- Gardnerville, NV Phone Book
- Ely, NV Phone Book
- Battle Mountain, NV Phone Book
- Minden, NV Phone Book
- Yerington, NV Phone Book
- Hawthorne, NV Phone Book
- Tonopah, NV Phone Book
- Lovelock, NV Phone Book
- Wells, NV Phone Book
- Stateline, NV Phone Book
- Beatty, NV Phone Book
- Indian Springs, NV Phone Book
- Virginia City, NV Phone Book
- Carson City, NV Phone Book
Local Time in Minden, NV
Local Time
03:21 AM
Date
Wednesday, April 30, 2025
Time Zone
PDT
Minden, NV Population
Chicago has a population of 3409 people. Sex ratio is 82.10 males per 100 females.
Population by Age
The median age in Chicago is 34.8 years.
| Age Groups | Population |
|---|---|
| Under 5 years | 103 |
| 5 to 9 years | 350 |
| 10 to 14 years | 57 |
| 15 to 19 years | 174 |
| 20 to 24 years | 135 |
| 25 to 29 years | 196 |
| 30 to 34 years | 215 |
| 35 to 39 years | 185 |
| 40 to 44 years | 109 |
| 45 to 49 years | 208 |
| 50 to 54 years | 258 |
| 55 to 59 years | 147 |
| 60 to 64 years | 327 |
| 65 to 69 years | 226 |
| 70 to 74 years | 210 |
| 75 to 79 years | 289 |
| 80 to 84 years | 108 |
| 85 years and over | 112 |
Race & Ethnicity
| Racial/Ethnic Groups | Percent |
|---|---|
| White | 2930 |
| Black or African American | 19 |
| American Indian and Alaska Native | 34 |
| Native Hawaiian and Other Pacific Islander | 4 |
| Some Other Race | 95 |
| Two or more races | 302 |