Reverse Phone Number Lookup in New Mexico
Reverse phone lookup in New Mexico helps you identify unknown callers by searching public government databases. This number lookup provides the registered owner's name, address, and more. A valuable tool across the Land of Enchantment. Use this reverse search to decide whether to call back the caller, ignore their call, or block future contact.
Reverse Phone Lookup by New Mexico Area Code
All New Mexico phone numbers consist of three parts: the three-digit Area Code,
the three-digit Prefix Code (also known as the exchange or central office code),
and the final four-digit line number. While the area code narrows down the
location to a large region, the prefix code can often specify the original city
or town where the number was registered.

Here's a complete list of New Mexico area codes:
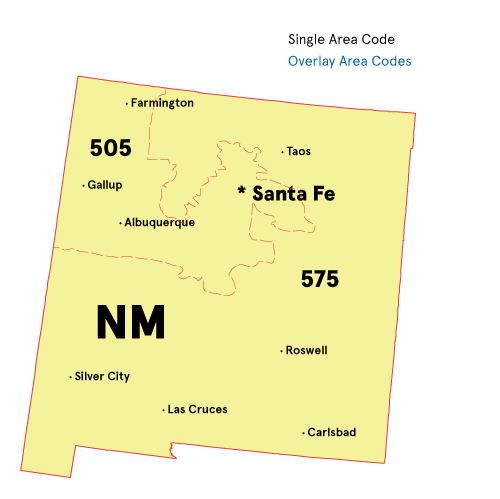
Area Code 505: Albuquerque, Rio Rancho, Santa Fe
Location: The 505 area code covers northern and central New Mexico, including major cities like Albuquerque, Santa Fe, and Farmington.
Common Callers: Sandia/Los Alamos National Labs background checkers, UNM Hospital appointments, and state government officials.
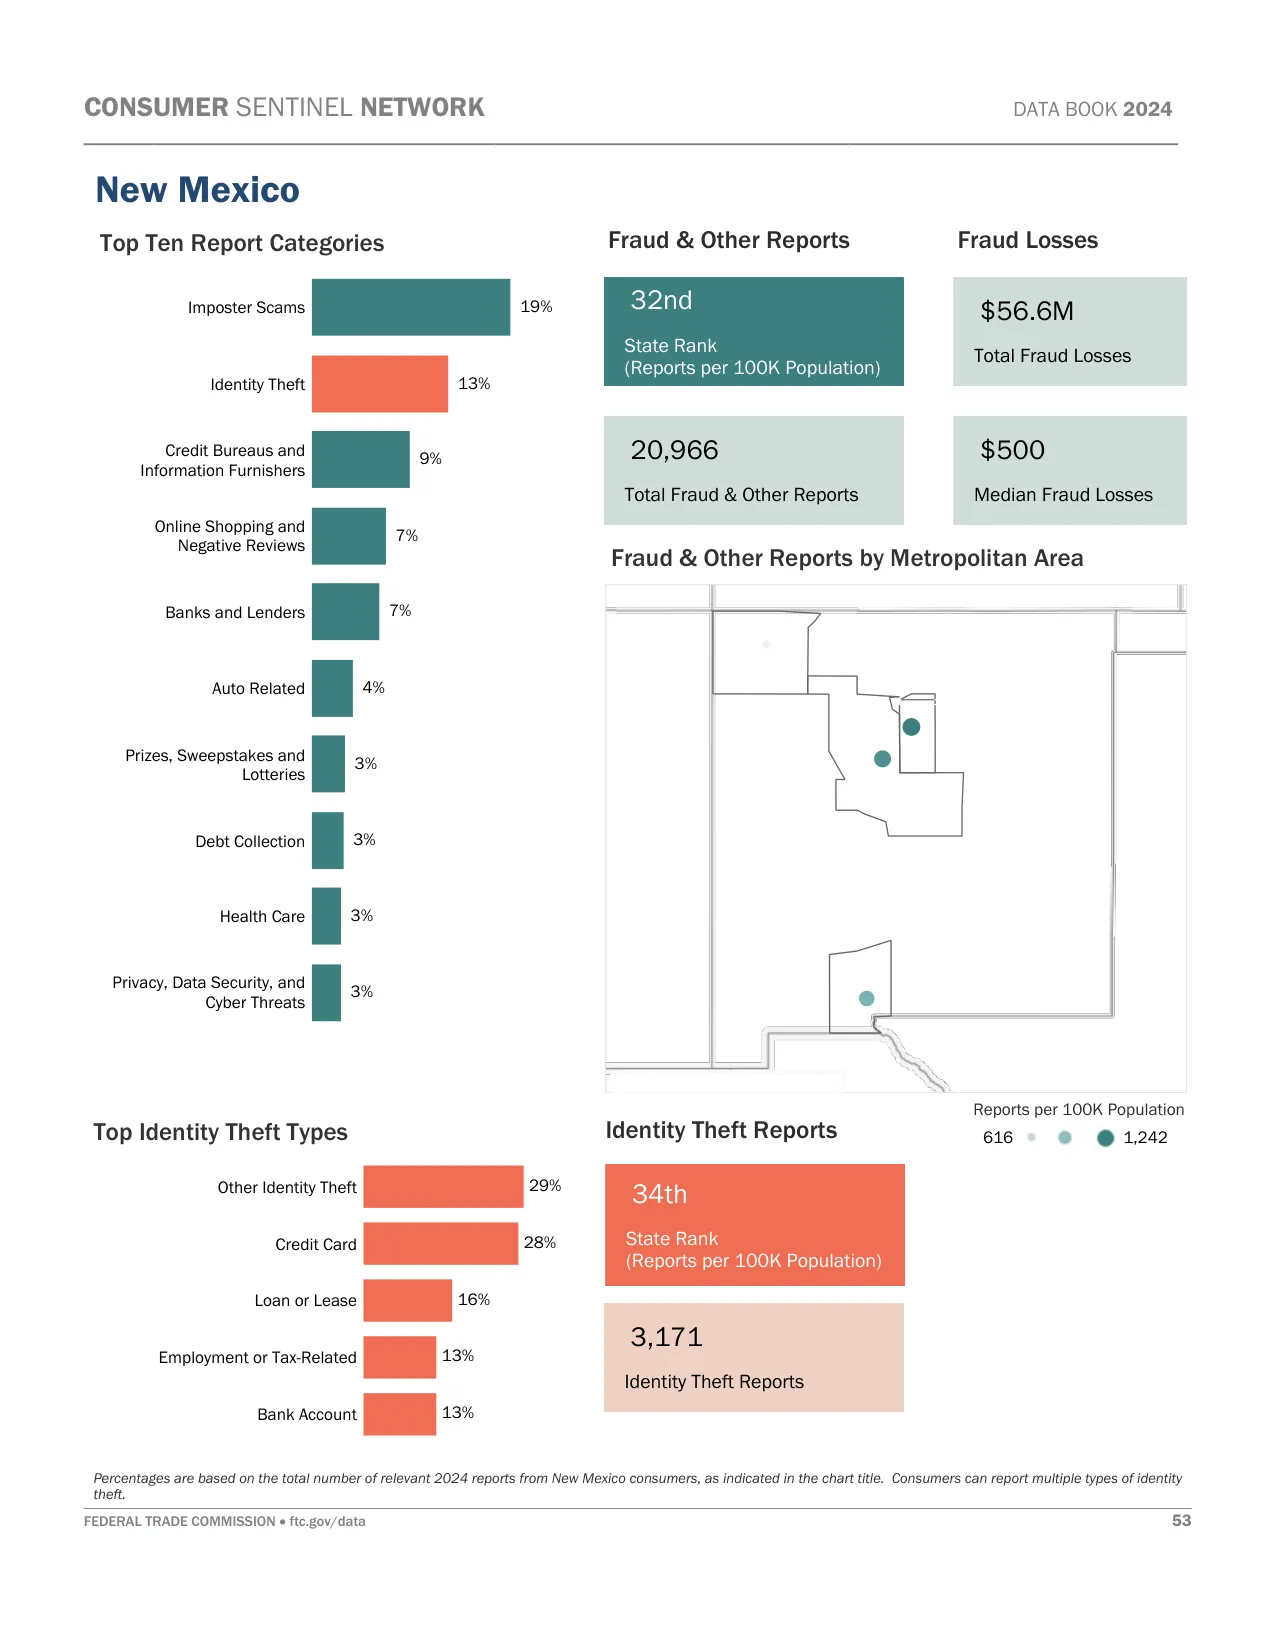
Scams and Spam Calls: The 505 area code is targeted by the "Comenity Bank" Impersonation scam and Remote Access Tech Support fraud. Fake Process Server & Pending Complaint scams are reported, along with the "Cash Offer For Your Home" call and Aggressive Information Phishing.
Area Code 575: Las Cruces, Roswell, Clovis
Location: The 575 area code covers southern and eastern New Mexico, including major cities like Las Cruces, Roswell, and Clovis.
Common Callers: White Sands Missile Range admin, Holloman/Cannon AFB personnel, and Permian Basin oil workers.
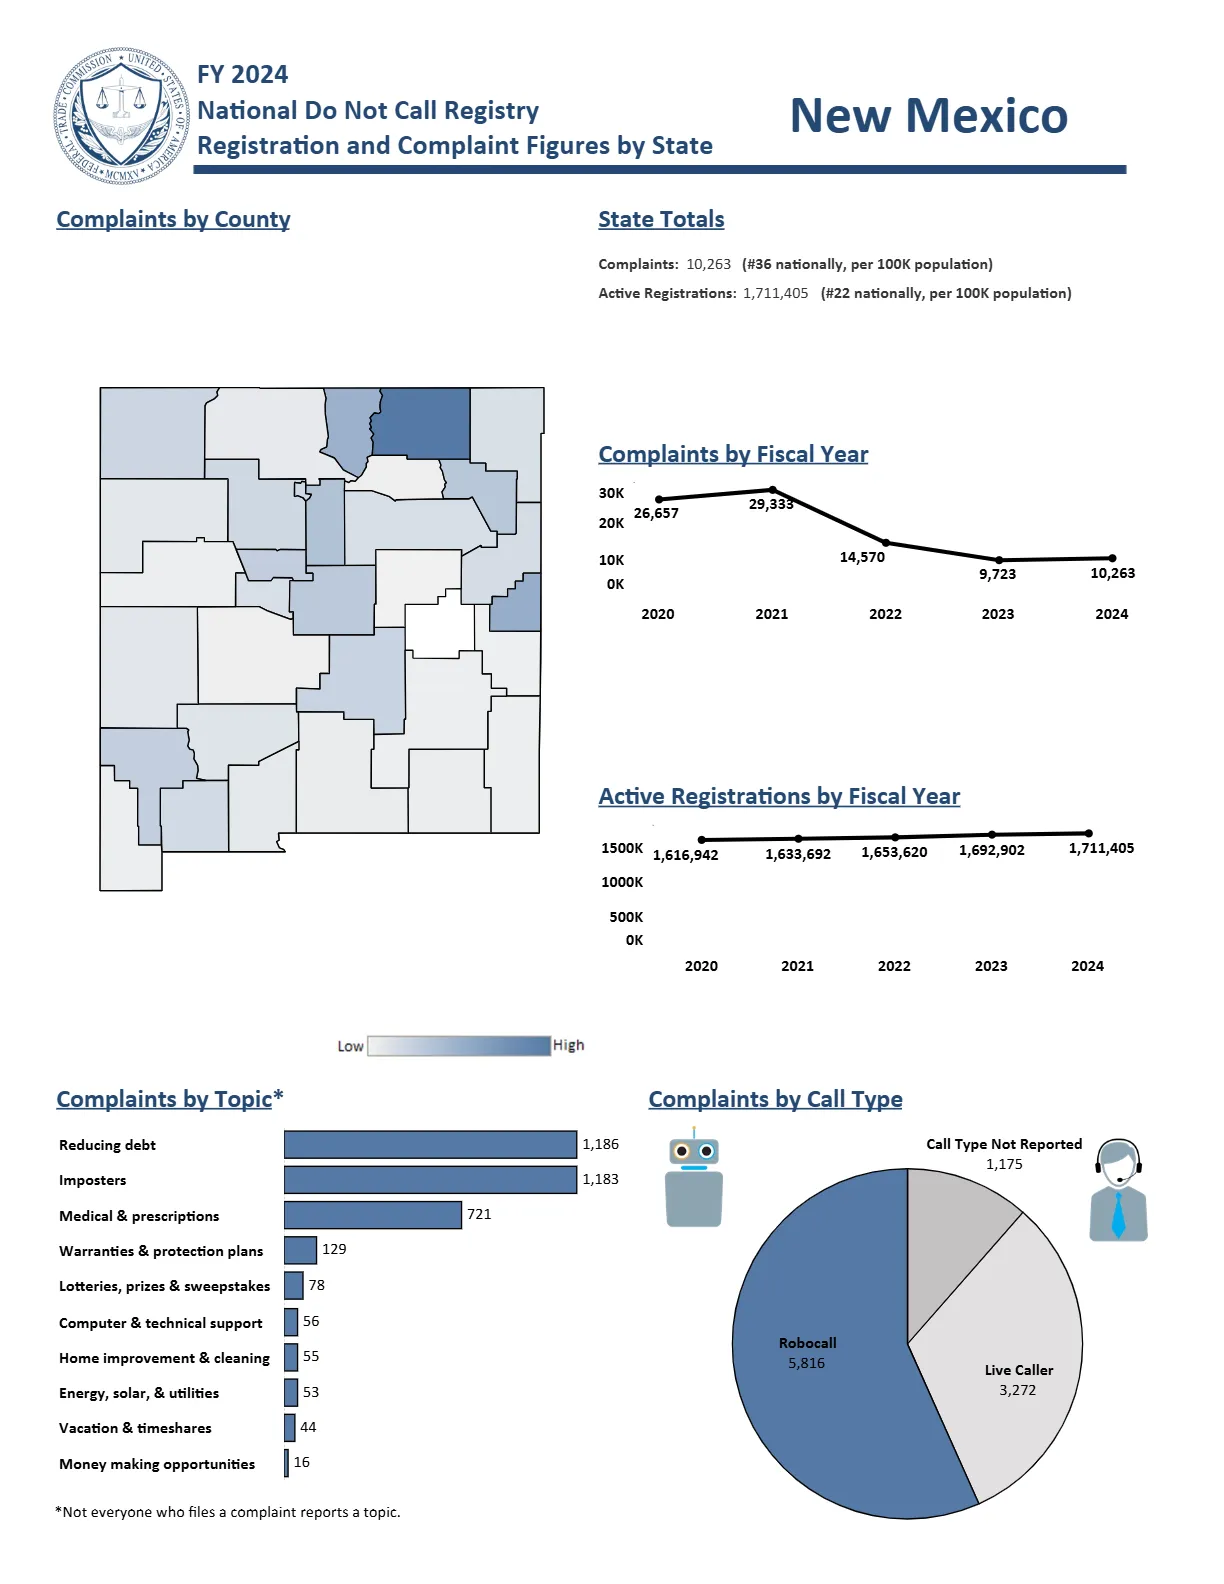
Scams and Spam Calls: The 575 area code reports NM Human Services Department (HSD) Phishing texts and Probate Real Estate Inquiry texts. "Inmate Calling" Phishing scams are common, as are Fake Legal Action/Warrant threats and Aggressive Vehicle Warranty robocalls.
Important: Area codes show where a number was originally assigned, not where the caller currently lives. Federal number portability laws
allow people to keep their phone numbers when moving or switching carriers. Use our reverse phone lookup tool above to get detailed phone number owner information.
For latest New Mexico phone numbering regulations, contact Brady Tolleson at the New Mexico SCC via [email protected] or 505-670-8354.
New Mexico Phone Numbers
New Mexico has approximately 2.8 million active phone numbers. Cell phones are the most popular with around 2.4 million users, while traditional landlines are less common, with about 184,000 connections. Internet phone services account for about 252,000 numbers.
When tracing a New Mexico phone number, it's highly probable that it's a cell phone. With the decline of landlines, newer phone numbers might be more challenging to trace compared to older landline numbers with more readily available public information.
New Mexico Voice Subscriptions (in thousands):
| Service Type |
June 2023 |
Dec 2023 |
June 2024 |
| Mobile telephony |
2,334 |
2,357 |
2,375 |
| Local exchange telephone service |
204 |
189 |
184 |
| VoIP subscriptions |
240 |
243 |
252 |
| Total |
2,778 |
2,789 |
2,811 |
Source: FCC Voice Telephone Services Report
Top 5 US Cell Phone Companies
Most phone numbers are cell phones, and most cell phone numbers come from the top three United States wireless companies. Here are the top five US Cell Phone Companies in Q1 2025:
- Verizon - 146 million customers
- T-Mobile US - 131 million customers
- AT&T Mobility - 118 million customers
- Boost Mobile - 7 million customers
- U.S. Cellular - 4.4 million customers


