Reverse Phone Number Lookup in New Jersey
A reverse phone lookup in New Jersey uncovers who owns any phone number using open public databases from government records. Get accurate name and address information instantly. A must-have for New Jerseyans dealing with high call volumes. This phone search lookup helps residents screen calls, avoid scammers, and determine whether unknown numbers belong to legitimate businesses or potential threats.
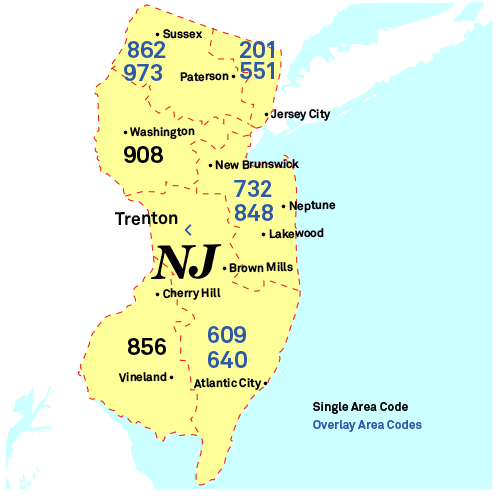
Reverse Phone Lookup by New Jersey Area Code
All New Jersey phone numbers consist of three parts: the three-digit Area Code,
the three-digit Prefix Code (also known as the exchange or central office code),
and the final four-digit line number. While the area code narrows down the
location to a large region, the prefix code can often specify the original city
or town where the number was registered.

Here's a complete list of New Jersey area codes:
Area Codes 201/551: Jersey City, Union City, Bayonne
Location: The 201 and 551 area codes cover northeastern New Jersey, including major cities like Jersey City, Hackensack, and Hoboken.
Common Callers: Goldman Sachs back-office support, Hackensack University Medical Center billing, and logistics coordinators.
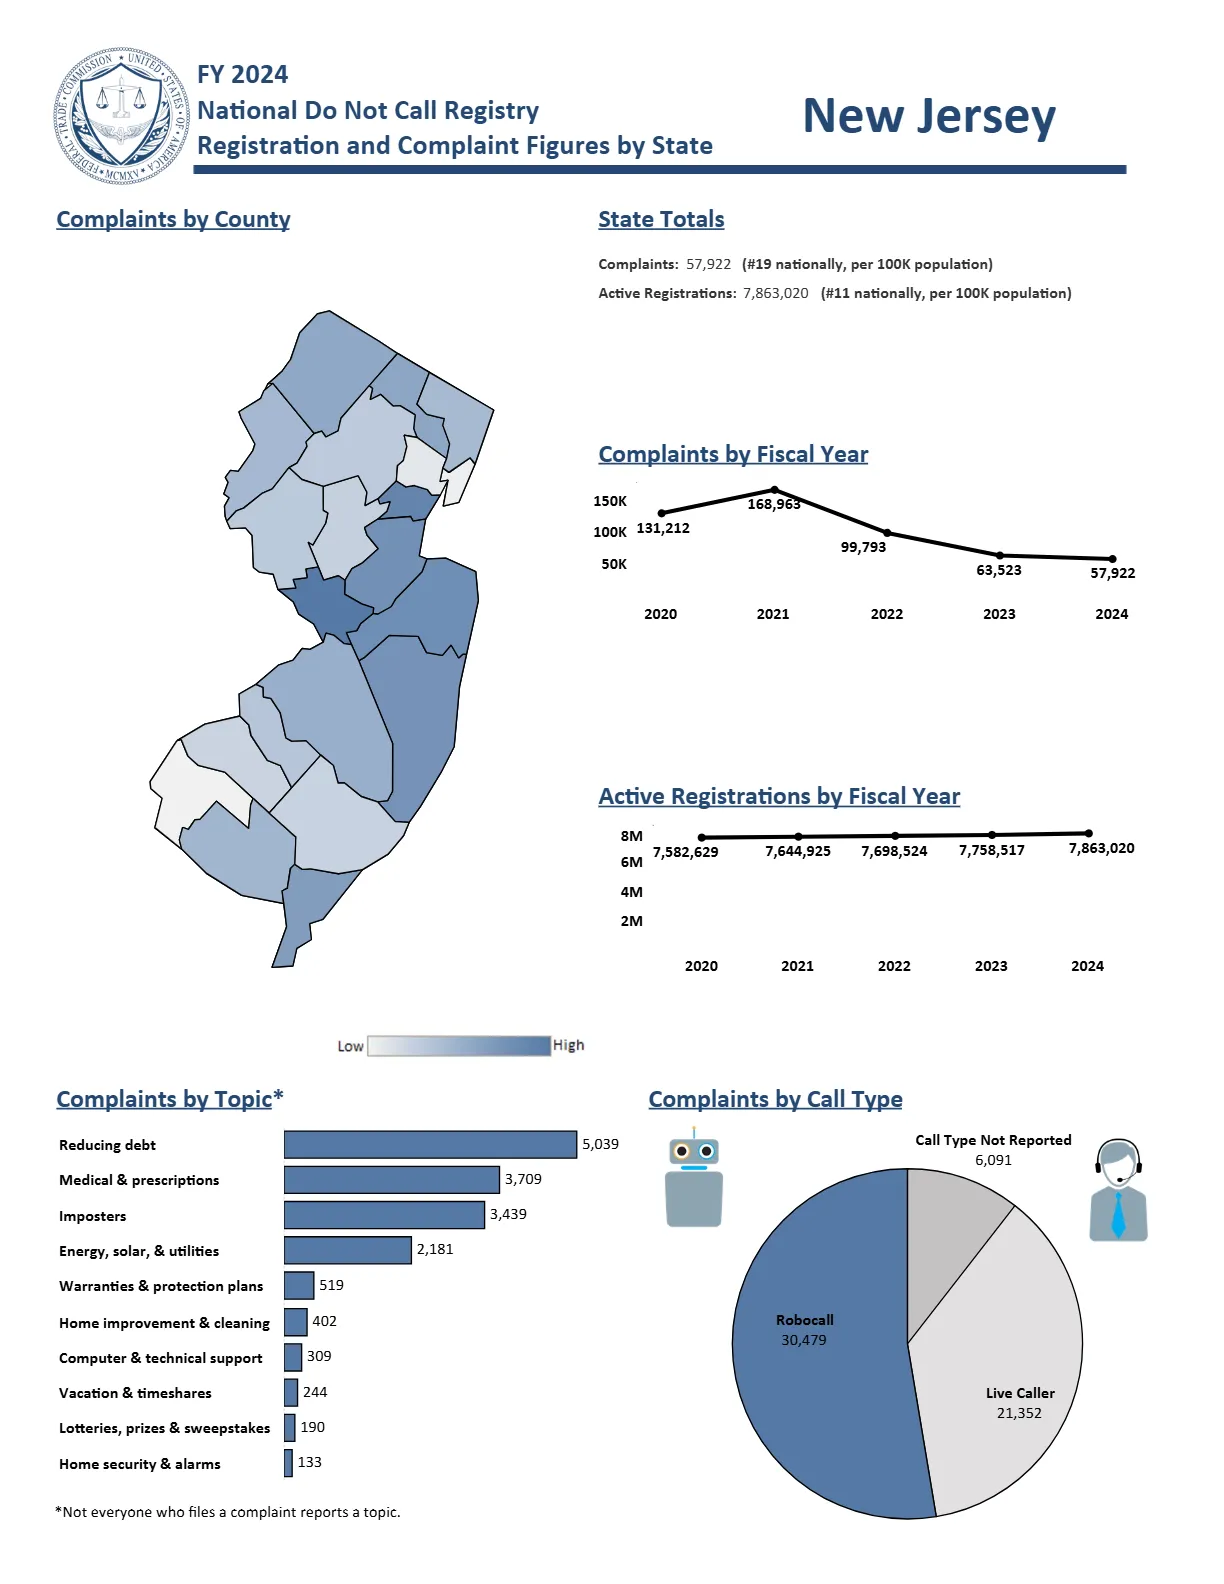
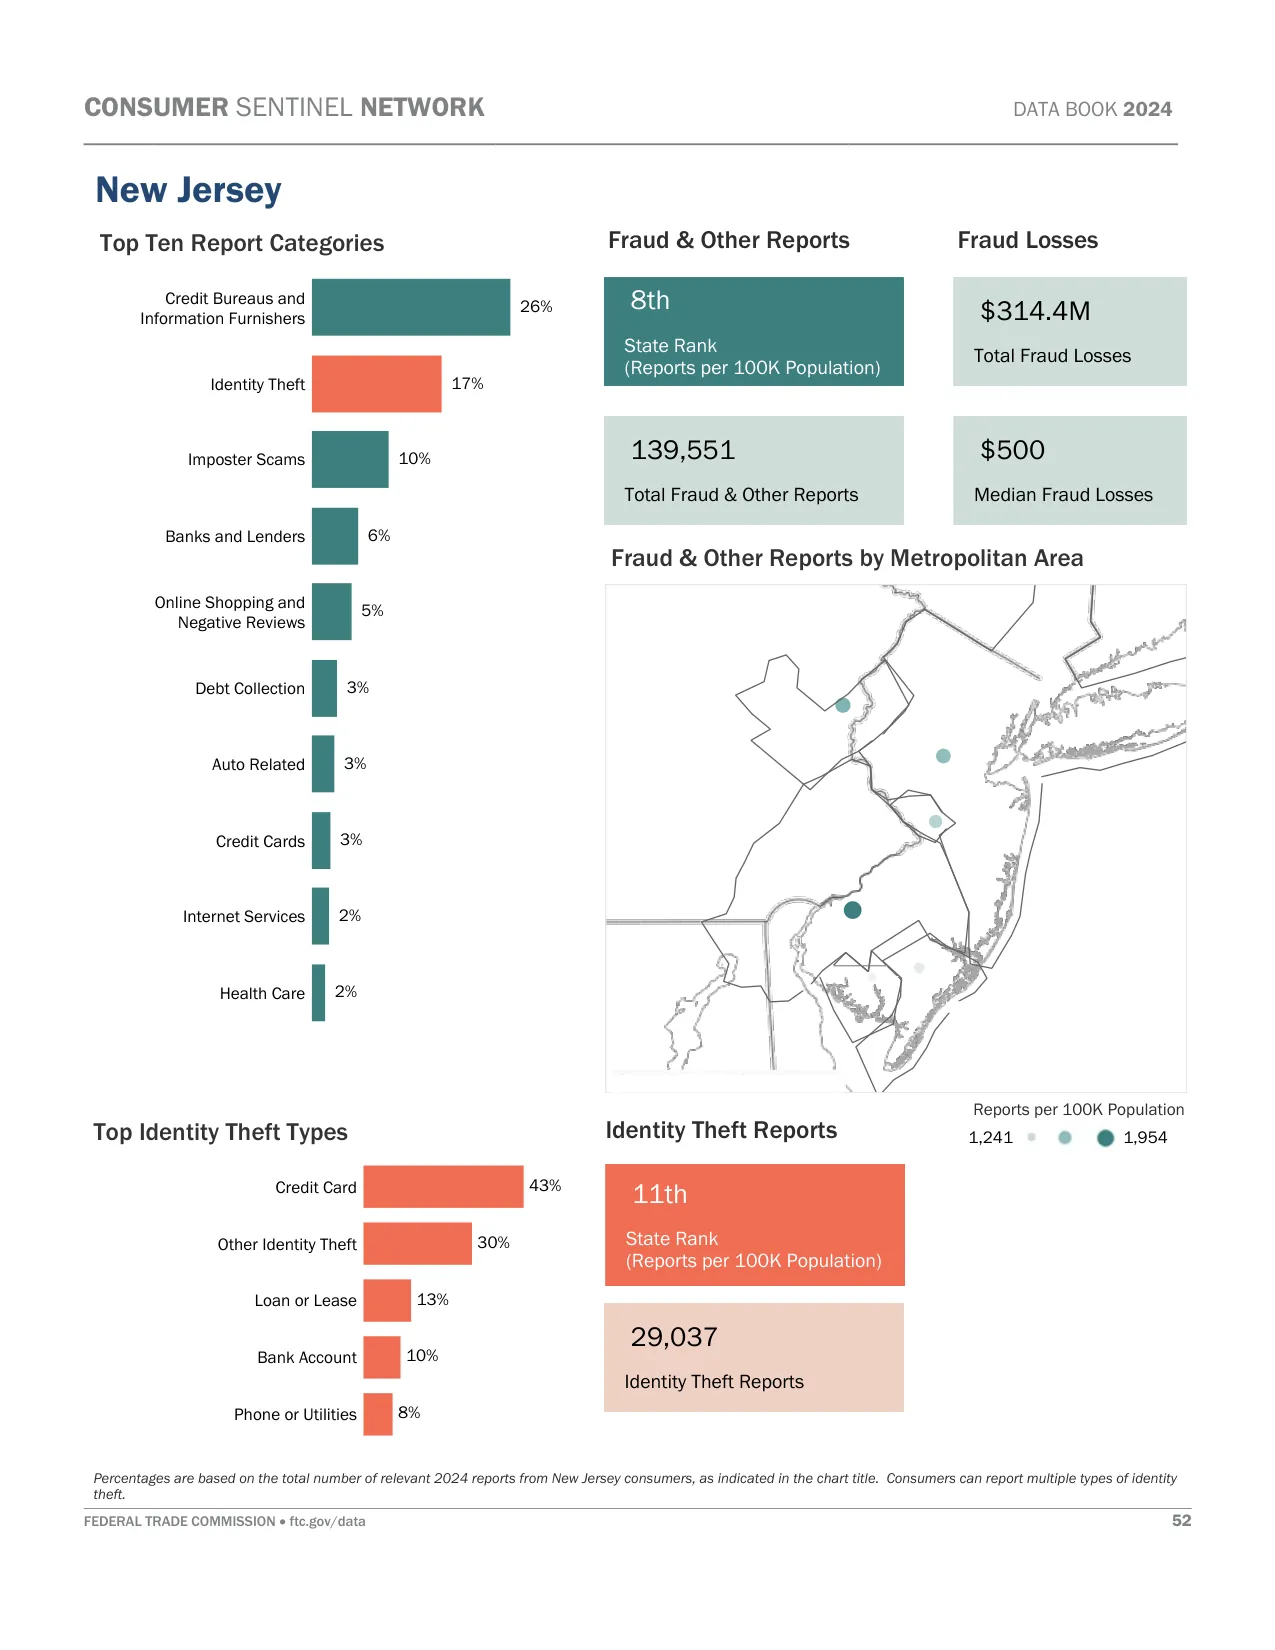
Scams and Spam Calls: The 201 and 551 area codes report New Jersey Utility Company Impersonation and Fake Delivery/Order Confirmation scams (DoorDash/Amazon). Business Compliance & OSHA scams are reported, along with Grandson in Jail scams, American Express Impersonation, and Aggressive Student Loan scams.
Area Codes 609/640: Trenton, Atlantic City, Pleasantville
Location: The 609 and 640 area codes cover central and southern New Jersey, including major cities like Trenton, Atlantic City, and Princeton.
Common Callers: New Jersey State government, Princeton University admissions, and Atlantic City casino marketing.
Scams and Spam Calls: The 609 and 640 area codes deal with NJ COVID-19 Vaccine & Booster scams and Business UCC Filing scams. Reader's Digest Sweepstakes scams are reported, along with Apple iCloud Breach threats, Grandparent Bail Money scams, and Amazon Fake Purchase confirmations.
Area Codes 732/848: Toms River, New Brunswick, Lakewood
Location: The 732 and 848 area codes cover central New Jersey, including major cities like Toms River, New Brunswick, and Red Bank.
Common Callers: Rutgers University staff, Johnson & Johnson corporate, and Hackensack Meridian Health nurses.
Scams and Spam Calls: The 732 and 848 area codes see PSE&G / JCP&L Utility Shut-Off threats and the "Heavy Breathing" Real Estate Stalker. PlayStation (PSN) Text-Me scams are reported, along with Bogus "County Services" threats, Aggressive Home Warranty calls, and Medicare scams.
Area Code 856: Camden, Vineland, Millville
Location: The 856 area code covers southwestern New Jersey, including major cities like Camden, Cherry Hill, and Vineland.
Common Callers: Campbell Soup Company corporate, Subaru of America support, and Cooper University Health Care.
Scams and Spam Calls: The 856 area code is targeted by New Jersey Unemployment Benefits scams and Freedom Mortgage Customer Impersonation. The "Joanna" Phishing Text is common, along with Fake Process Server threats, Amazon/Apple Fraudulent Purchase scams, and Unsolicited Real Estate "Investor" calls.
Area Codes 862/973: Newark, Paterson, Clifton
Location: The 862 and 973 area codes cover northern New Jersey, including major cities like Newark, Paterson, and Clifton.
Common Callers: Prudential Financial agents, PSEG utility alerts, and Newark Airport logistics.
Scams and Spam Calls: The 862 and 973 area codes report Horizon NJ Health & Medicare Phishing and Business "IT Manager" Impersonation. PSE&G Utility Shut-Off scams are frequent, as are Grandparent in Distress scams, Fake Police Charity donations, and Aggressive Home Buyer offers.
Area Code 908: Elizabeth, Plainfield, Linden
Location: The 908 area code covers central New Jersey, including major cities like Elizabeth, Plainfield, and Somerville.
Common Callers: Merck & Co. pharma sales, Nokia (Bell Labs) researchers, and insurance carriers.
Scams and Spam Calls: The 908 area code gets PSE&G Utility Bill Impersonation and the "Grandma, I'm in Jail" scam. Fake Process Server & Debt Collection threats are common, along with "Final Notice" Car Warranty robocalls and Social Security "Legal Action" scams.
Important: Area codes show where a number was originally assigned, not where the caller currently lives. Federal number portability laws
allow people to keep their phone numbers when moving or switching carriers. Use our reverse phone lookup tool above to get detailed phone number owner information.
For latest New Jersey phone numbering regulations, contact Jimarli Figueiredo at the New Jersey BPU via [email protected] or 609-633-9727.
New Jersey Phone Numbers
New Jersey has approximately 14.7 million active phone numbers. Cell phones are the dominant type with 11.4 million users, while traditional landlines are in decline with 538,000 connections statewide. Internet phone services account for about 2.7 million numbers.
Therefore, tracing a New Jersey phone number will likely lead to a cell phone. The decline of landlines suggests that newer phone numbers may be more challenging to trace compared to older landline numbers, which typically had more readily available public information.
New Jersey Voice Subscriptions (in thousands):
| Service Type |
June 2023 |
Dec 2023 |
June 2024 |
| Mobile telephony |
11,093 |
11,334 |
11,427 |
| Local exchange telephone service |
765 |
576 |
538 |
| VoIP subscriptions |
2,727 |
2,700 |
2,723 |
| Total |
14,585 |
14,610 |
14,688 |
Source: FCC Voice Telephone Services Report
Top 5 US Cell Phone Companies
Most phone numbers are cell phones, and most cell phone numbers come from the top three United States wireless companies. Here are the top five US Cell Phone Companies in Q1 2025:
- Verizon - 146 million customers
- T-Mobile US - 131 million customers
- AT&T Mobility - 118 million customers
- Boost Mobile - 7 million customers
- U.S. Cellular - 4.4 million customers


