Rockport Phone Book
Public Schools
Alternative Fuel Stations
Rockport Reverse Phone Lookup
Browse Chicago phone numbers by rate center and prefix.
Rockport Phone Numbers
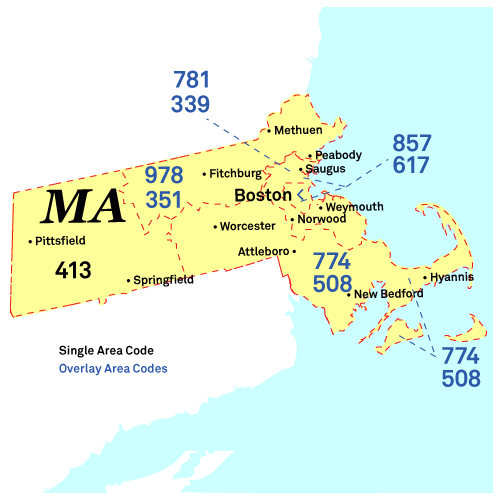
Rate Center: Rockport (ROCKPORT)
Phone numbers with the Rockport rate center prefixes:
Illinois City Phone Books
- Boston, MA Phone Book
- Worcester, MA Phone Book
- Springfield, MA Phone Book
- Cambridge, MA Phone Book
- Lowell, MA Phone Book
- Brockton, MA Phone Book
- New Bedford, MA Phone Book
- Quincy, MA Phone Book
- Lynn, MA Phone Book
- Fall River, MA Phone Book
- Newton, MA Phone Book
- Somerville, MA Phone Book
- Lawrence, MA Phone Book
- Framingham, MA Phone Book
- Haverhill, MA Phone Book
- Waltham, MA Phone Book
- Malden, MA Phone Book
- Brookline, MA Phone Book
- Medford, MA Phone Book
- Taunton, MA Phone Book
- Weymouth Town, MA Phone Book
- Chicopee, MA Phone Book
- Revere, MA Phone Book
- Peabody, MA Phone Book
- Methuen Town, MA Phone Book
- Everett, MA Phone Book
- Arlington, MA Phone Book
- Attleboro, MA Phone Book
- Barnstable Town, MA Phone Book
- Salem, MA Phone Book
- Pittsfield, MA Phone Book
- Beverly, MA Phone Book
- Leominster, MA Phone Book
- Westfield, MA Phone Book
- Fitchburg, MA Phone Book
- Woburn, MA Phone Book
- Holyoke, MA Phone Book
- Amherst Town, MA Phone Book
- Chelsea, MA Phone Book
- Marlborough, MA Phone Book
- Braintree Town, MA Phone Book
- Watertown Town, MA Phone Book
- Randolph Town, MA Phone Book
- Franklin Town, MA Phone Book
- Lexington, MA Phone Book
- Needham, MA Phone Book
- Gloucester, MA Phone Book
- Norwood, MA Phone Book
- North Attleborough Town, MA Phone Book
- Wellesley, MA Phone Book
- Agawam Town, MA Phone Book
- Northampton, MA Phone Book
- West Springfield Town, MA Phone Book
- Saugus, MA Phone Book
- Burlington, MA Phone Book
- Melrose, MA Phone Book
- Milton, MA Phone Book
- Danvers, MA Phone Book
- Bridgewater Town, MA Phone Book
- Wakefield, MA Phone Book
- Belmont, MA Phone Book
- Milford, MA Phone Book
- Dedham, MA Phone Book
- Reading, MA Phone Book
- Stoneham, MA Phone Book
- Wilmington, MA Phone Book
- Winchester, MA Phone Book
- Gardner, MA Phone Book
- Marblehead, MA Phone Book
- Winthrop Town, MA Phone Book
- Newburyport, MA Phone Book
- Somerset, MA Phone Book
- Amesbury Town, MA Phone Book
- Greenfield, MA Phone Book
- Southbridge Town, MA Phone Book
- Easthampton Town, MA Phone Book
- Longmeadow, MA Phone Book
- Hudson, MA Phone Book
- Swampscott, MA Phone Book
- Lynnfield, MA Phone Book
- North Adams, MA Phone Book
- Palmer Town, MA Phone Book
- Maynard, MA Phone Book
- South Yarmouth, MA Phone Book
- Andover, MA Phone Book
- Nantucket, MA Phone Book
- Athol, MA Phone Book
- Plymouth, MA Phone Book
- Kingston, MA Phone Book
- Medfield, MA Phone Book
- Northborough, MA Phone Book
- West Yarmouth, MA Phone Book
- Sharon, MA Phone Book
- Walpole, MA Phone Book
- Foxborough, MA Phone Book
- Scituate, MA Phone Book
- Hingham, MA Phone Book
- Rockport, MA Phone Book
- Marshfield, MA Phone Book
- Ipswich, MA Phone Book
- Winchendon, MA Phone Book
- Williamstown, MA Phone Book
- Bellingham, MA Phone Book
- Westborough, MA Phone Book
- Orange, MA Phone Book
- Hopkinton, MA Phone Book
- Falmouth, MA Phone Book
- Wilbraham, MA Phone Book
- Belchertown, MA Phone Book
- Sandwich, MA Phone Book
- Boxford, MA Phone Book
- Provincetown, MA Phone Book
- Dover, MA Phone Book
- Great Barrington, MA Phone Book
- South Deerfield, MA Phone Book
- Sturbridge, MA Phone Book
- Lenox, MA Phone Book
- Duxbury, MA Phone Book
- Chatham, MA Phone Book
- Orleans, MA Phone Book
- Lee, MA Phone Book
- Bourne, MA Phone Book
- Groton, MA Phone Book
- Edgartown, MA Phone Book
- Concord, MA Phone Book
- Bedford, MA Phone Book
- Cohasset, MA Phone Book
- Seekonk, MA Phone Book
- Wrentham, MA Phone Book
- South Boston, MA Phone Book
- Grafton, MA Phone Book
- Dighton, MA Phone Book
- Natick, MA Phone Book
- Hadley, MA Phone Book
- Charlton, MA Phone Book
- Wayland, MA Phone Book
- Weston, MA Phone Book
- Millbury, MA Phone Book
- North Easton, MA Phone Book
- Pembroke, MA Phone Book
- Fairhaven, MA Phone Book
- Canton, MA Phone Book
- Auburn, MA Phone Book
- North Andover, MA Phone Book
- Norwell, MA Phone Book
- Raynham, MA Phone Book
- Hanover, MA Phone Book
- Sterling, MA Phone Book
- West Tisbury, MA Phone Book
- Dorchester, MA Phone Book
- Stoughton, MA Phone Book
- Middleborough, MA Phone Book
- Harwich, MA Phone Book
- Swansea, MA Phone Book
- Hyde Park, MA Phone Book
- Eastham, MA Phone Book
- Lincoln, MA Phone Book
- Douglas, MA Phone Book
- Roxbury, MA Phone Book
- Shrewsbury, MA Phone Book
- Dartmouth, MA Phone Book
- Brighton, MA Phone Book
- Jamaica Plain, MA Phone Book
- Norton, MA Phone Book
- Roslindale, MA Phone Book
- Stockbridge, MA Phone Book
- Leicester, MA Phone Book
- Billerica, MA Phone Book
- Chelmsford, MA Phone Book
- Westwood, MA Phone Book
- Rockland, MA Phone Book
- Sudbury, MA Phone Book
- Mansfield, MA Phone Book
- Dudley, MA Phone Book
- Charlestown, MA Phone Book
- Hyannis, MA Phone Book
- Tewksbury, MA Phone Book
- South Hadley, MA Phone Book
- Mattapan, MA Phone Book
- Tyngsborough, MA Phone Book
- Ludlow, MA Phone Book
- Mashpee, MA Phone Book
- Mattapoisett, MA Phone Book
- East Longmeadow, MA Phone Book
- Westford, MA Phone Book
- Acton, MA Phone Book
- East Boston, MA Phone Book
- Medway, MA Phone Book
- Littleton, MA Phone Book
- Wareham, MA Phone Book
- Southborough, MA Phone Book
- Wellfleet, MA Phone Book
- West Newbury, MA Phone Book
Local Time in Rockport, MA
Local Time
04:26 AM
Date
Wednesday, April 30, 2025
Time Zone
EDT
Rockport, MA Population
Chicago has a population of 5247 people. Sex ratio is 81.40 males per 100 females.
Population by Age
The median age in Chicago is 34.8 years.
| Age Groups | Population |
|---|---|
| Under 5 years | 215 |
| 5 to 9 years | 113 |
| 10 to 14 years | 205 |
| 15 to 19 years | 255 |
| 20 to 24 years | 137 |
| 25 to 29 years | 125 |
| 30 to 34 years | 244 |
| 35 to 39 years | 168 |
| 40 to 44 years | 202 |
| 45 to 49 years | 230 |
| 50 to 54 years | 302 |
| 55 to 59 years | 500 |
| 60 to 64 years | 591 |
| 65 to 69 years | 508 |
| 70 to 74 years | 690 |
| 75 to 79 years | 277 |
| 80 to 84 years | 177 |
| 85 years and over | 308 |
Race & Ethnicity
| Racial/Ethnic Groups | Percent |
|---|---|
| White | 4656 |
| Black or African American | 37 |
| American Indian and Alaska Native | 1 |
| Native Hawaiian and Other Pacific Islander | 0 |
| Some Other Race | 55 |
| Two or more races | 209 |