Mobile numbers make up roughly 87% of Idaho phone subscriptions. Area codes 208 and 986 cover the entire state, and the most reported threats are callers posing as Apple support claiming your iCloud has been breached and car warranty robocalls claiming your coverage is about to expire. Don't just trust the caller ID. Our Idaho reverse phone lookup can often show you whether that 208 or 986 number really belongs to Apple Support or someone pretending to be them.
Scam & Spam Phone Number Lookup
Idahoans are increasingly flagging political survey robocalls and fake Amazon alerts that disrupt their day. Join your neighbors in identifying these pests—check the number to see who is really calling.
Recently Reported Spam Numbers
Phone numbers reported as unwanted calls to the FTC by local residents in the last 30 days.
(208) 205-8876
76 reports
·
(888) 269-4978
10 reports
·
(469) 208-4402
5 reports
·
(912) 567-3699
3 reports
·
(217) 834-9977
3 reports
·
(651) 867-3293
2 reports
·
(831) 609-3250
2 reports
·
(434) 253-2154
2 reports
·
(877) 578-3476
2 reports
·
(208) 854-1706
2 reports
·
Phone Scams
Political surveys and Car Warranty calls are the most frequent reports. In 2024, Idaho residents reported 10,359 fraud cases resulting in total losses of $53,935,183, with a median loss of $490 per victim. To help authorities track these criminals, you should report any fraudulent calls to:
In 2024, Idaho residents filed 9,300 unwanted call complaints with the FTC, of which 5,342 were robocalls and 3,034 involved live callers.
The most reported complaint topics were imposters (790), reducing debt (632), medical and prescriptions (612).
One of the most effective ways to lower the volume of these calls is through the National Do Not Call Registry. Visit donotcall.gov or call 1-888-382-1222 to protect your number.
Area Codes by City
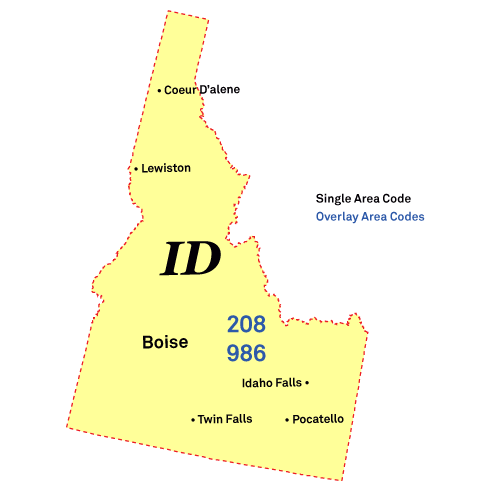
The 208 area code covers every inch of Idaho, from Boise 's urban core to Sun Valley 's resorts to Idaho Falls and beyond. Statewide coverage, zero location detail. Don 't waste time wondering. Check the number to get the owner 's name and city.
Important: Area codes are no longer reliable indicators of a caller's location. Number portability allows users to keep their numbers when they move, and scammers frequently use "neighbor spoofing" to make long-distance or fraudulent calls appear local.
Boise City, Nampa & Meridian (Area Codes 208/986)
All Idaho phone numbers use 208 or its statewide overlay 986, including Boise City, Nampa, Meridian, Idaho Falls, and Pocatello. Idaho is covered by a single overlay complex spanning the entire state.
Are Reverse Phone Lookups Legal in Idaho?
Yes, using reverse phone lookup services is completely legal in Idaho when used for personal purposes like identifying unknown numbers or avoiding scam calls. That said, federal law under the Fair Credit Reporting Act (FCRA) prohibits using lookup results for hiring decisions, tenant screening, or determining credit eligibility.
FAQs
How do I remove my number from reverse phone directories in Idaho?
Idaho doesn't have a privacy law, but you can still ask to be removed from reverse phone directories. Look for an opt-out form on each site or contact their support team to request removal.
Is this business call from Idaho legit?
If you are unsure about a business call, keep in mind that Idaho has over 57,209 business establishments according to Census data. To verify a specific company, use the Idaho Business Entity Search to check its registration.
What kind of phone numbers does Idaho use?
Idaho has 2 million mobile subscriptions, 185,000 VoIP lines, and 116,000 landlines.