Reverse Phone Number Lookup in Colorado
A reverse phone lookup in Colorado helps you find out who owns any phone number by searching public databases compiled from government sources. This number lookup service returns the registered owner's name, address, and other details to help Coloradans avoid scams, verify contacts, and decide whether to answer or block calls. Use this reverse search to check unknown numbers before calling back.
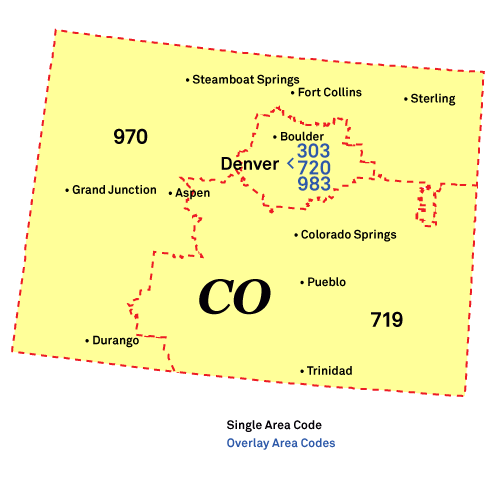
Reverse Phone Lookup by Colorado Area Code
All Colorado phone numbers consist of three parts: the three-digit Area Code,
the three-digit Prefix Code (also known as the exchange or central office code),
and the final four-digit line number. While the area code narrows down the
location to a large region, the prefix code can often specify the original city
or town where the number was registered.

Here's a complete list of Colorado area codes:
Area Codes 303/720/983: Denver, Aurora, Lakewood
Location: The 303, 720, and 983 area codes cover the north-central portion of Colorado, including major cities like Denver, Boulder, and Aurora.
Common Callers: Federal benefits administrators (Denver Federal Center), DaVita dialysis schedulers, and University of Colorado Boulder alumni calls.
Scams and Spam Calls: The 303, 720, and 983 area codes see frequent Xcel Energy Shut-Off threats and Sheriff's Department Jury Duty Warrant scams. Residents are targeted by Fake FedEx/Delivery "Failure to Comply" scams, Aggressive "Speak to the Owner" business calls, and IRS/Social Security threats.
Area Code 719: Colorado Springs, Pueblo, Security-Widefield
Location: The 719 area code covers southeastern and southern Colorado, including major cities like Colorado Springs, Pueblo, and Trinidad.
Common Callers: Defense contractor recruiters (Northrop/Boecore), USAA insurance representatives, and Air Force Academy staff.
Scams and Spam Calls: The 719 area code experiences Aggressive "We Want to Buy Your House" calls and Fake Police/Firefighter Donation scams. Common issues include Fake Process Server/Debt Collection threats, Social Security and Medicare suspension scams, and Tech Support fraud.
Area Code 970: Fort Collins, Greeley, Loveland
Location: The 970 area code covers northern and western Colorado, including major cities like Fort Collins, Grand Junction, and Durango.
Common Callers: Ski resort booking agents (Vail/Aspen), CSU Fort Collins alumni association, and energy extraction landmen.
Scams and Spam Calls: The 970 area code reports specific Colorado Solar Program scams and Aggressive Business Supply schemes. Fake Job/Resume text scams are common, along with Amazon/Netflix Subscription fraud, Vehicle Warranty expiration calls, and standard IRS/Social Security threats.
Important: Area codes show where a number was originally assigned, not where the caller currently lives. Federal number portability laws
allow people to keep their phone numbers when moving or switching carriers. Use our reverse phone lookup tool above to get detailed phone number owner information.
For latest Colorado phone numbering regulations, contact Gladys Rey at the Colorado PUC via [email protected] or 303-894-2843.
Colorado Phone Numbers
Colorado has approximately 8.2 million active phone numbers. Cell phones are the most popular with 6.6 million users, while traditional landlines are declining with 360,000 connections statewide. Internet phone services account for about 1.2 million numbers.
This indicates that searching a Colorado phone number will most likely lead to a cell phone. The decrease in landlines suggests that newer phone numbers may be harder to trace compared to older landline numbers with more readily available public information.
Colorado Voice Subscriptions (in thousands):
| Service Type |
June 2023 |
Dec 2023 |
June 2024 |
| Mobile telephony |
6,391 |
6,500 |
6,635 |
| Local exchange telephone service |
409 |
376 |
360 |
| VoIP subscriptions |
1,206 |
1,164 |
1,216 |
| Total |
8,006 |
8,040 |
8,211 |
Source: FCC Voice Telephone Services Report
Top 5 US Cell Phone Companies
Most phone numbers are cell phones, and most cell phone numbers come from the top three United States wireless companies. Here are the top five US Cell Phone Companies in Q1 2025:
- Verizon - 146 million customers
- T-Mobile US - 131 million customers
- AT&T Mobility - 118 million customers
- Boost Mobile - 7 million customers
- U.S. Cellular - 4.4 million customers


