Reverse Phone Number Lookup in West Virginia
A reverse phone lookup in West Virginia identifies who's calling using open government databases. This number lookup provides the registered owner's name and address. A valuable service for West Virginians. Use this phone search to answer "who called me" and determine whether unknown numbers belong to legitimate sources before answering.
Reverse Phone Lookup by West Virginia Area Code
All West Virginia phone numbers consist of three parts: the three-digit Area Code,
the three-digit Prefix Code (also known as the exchange or central office code),
and the final four-digit line number. While the area code narrows down the
location to a large region, the prefix code can often specify the original city
or town where the number was registered.

Here's a complete list of West Virginia area codes:
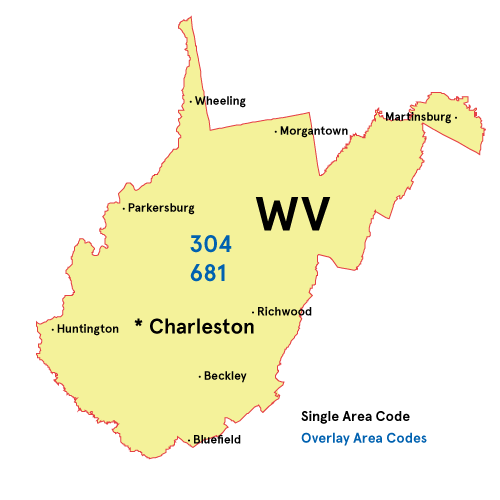
Area Codes 304/681: Charleston, Huntington, Parkersburg
Location: The 304 and 681 area codes cover the entire state of West Virginia, including major cities like Charleston, Huntington, and Wheeling.
Common Callers: VA Medical Center staff, WVU Medicine appointment lines, and State Capitol administrative offices.
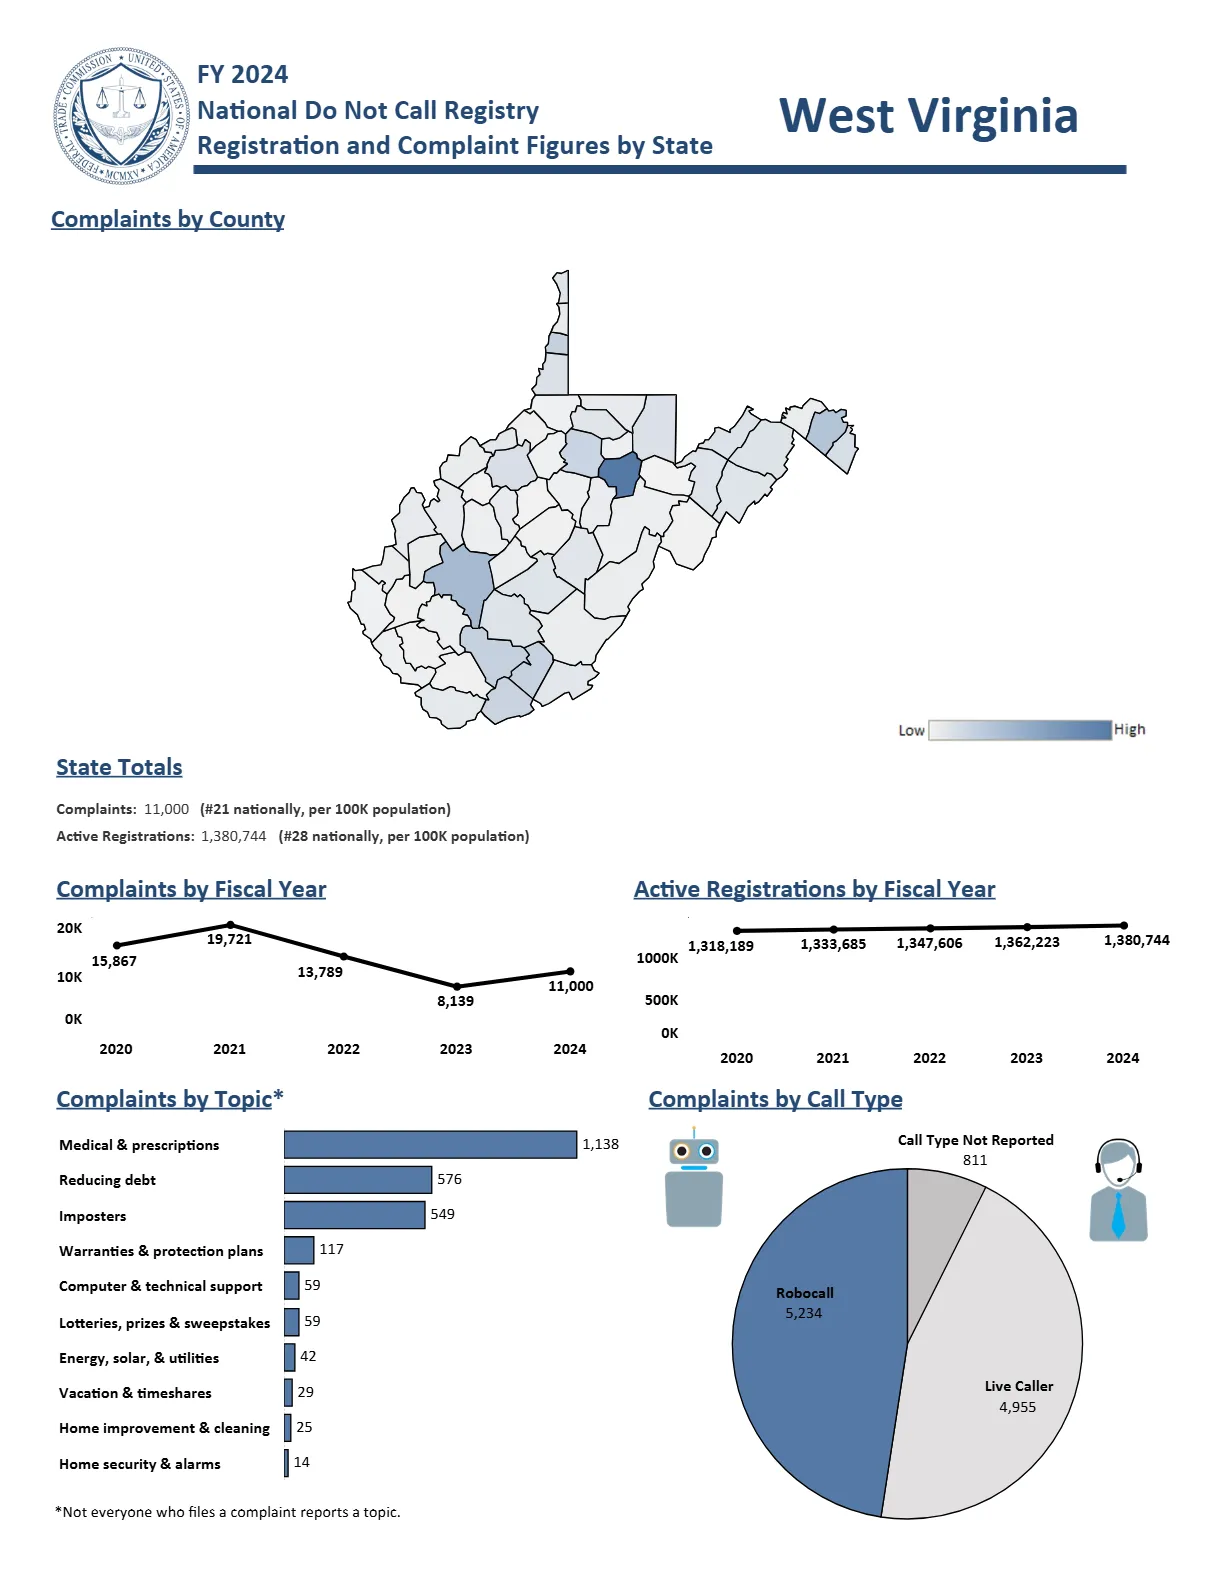
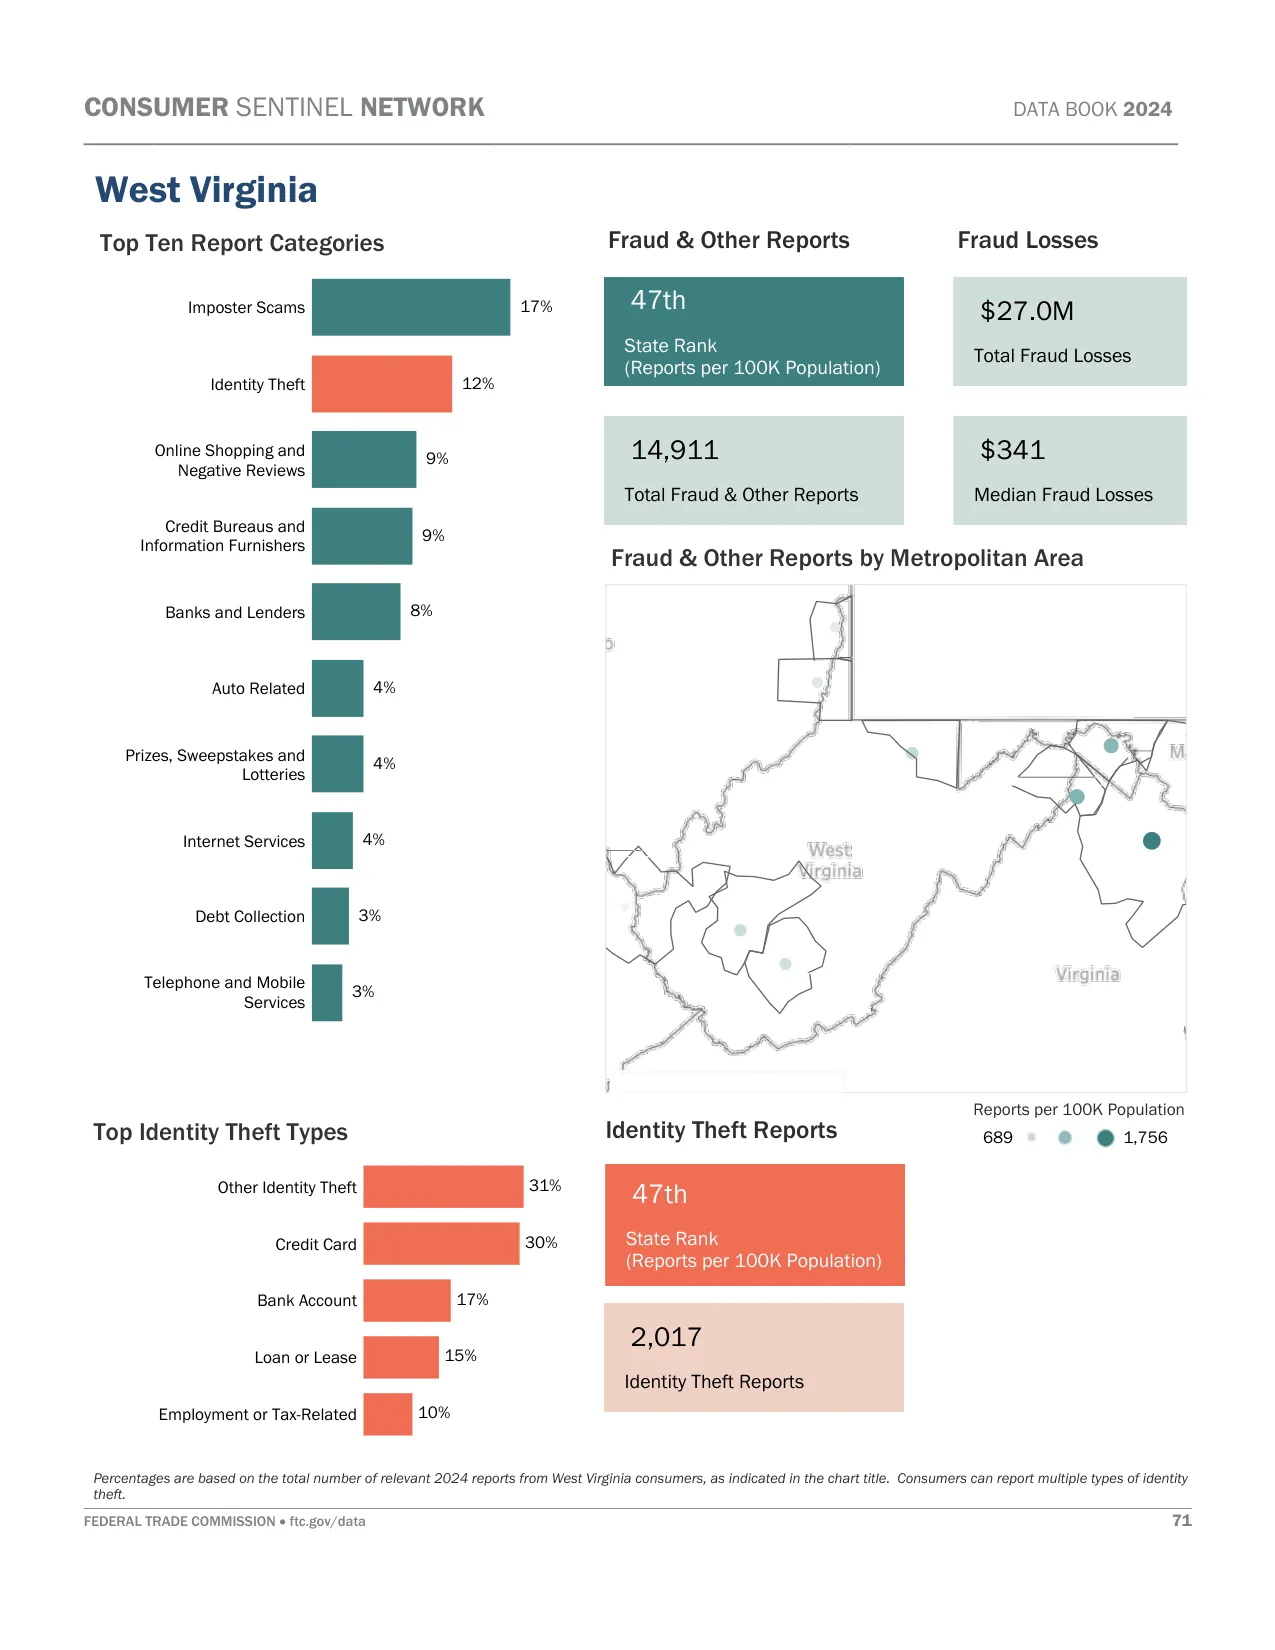
Scams and Spam Calls: The 304 and 681 area codes encounter "Quick Cash" Loan & Student Loan scams and Home Security & Utility scams. Fake Legal Action & Court Summons are common, along with Aggressive Health Insurance & Medicare scams and Publishers Clearing House Prize fraud.
Important: Area codes show where a number was originally assigned, not where the caller currently lives. Federal number portability laws
allow people to keep their phone numbers when moving or switching carriers. Use our reverse phone lookup tool above to get detailed phone number owner information.
For latest West Virginia phone numbering regulations, contact C. Todd Midkiff at the West Virginia PSC via [email protected] or 304-340-0315.
West Virginia Phone Numbers
West Virginia has approximately 2.2 million active phone numbers. Cell phones are the dominant type, accounting for about 1.7 million users. Landlines continue to decline, now at approximately 200,000 connections statewide, while internet phone services hold steady at around 264,000 numbers.
Searching a West Virginia phone number is most likely to return a cell phone. Due to the move away from traditional landlines, newer numbers are often more difficult to trace than the older landline numbers which historically had more publicly accessible information.
West Virginia Voice Subscriptions (in thousands):
| Service Type |
June 2023 |
Dec 2023 |
June 2024 |
| Mobile telephony |
1,704 |
1,718 |
1,714 |
| Local exchange telephone service |
223 |
210 |
200 |
| VoIP subscriptions |
265 |
269 |
264 |
| Total |
2,192 |
2,197 |
2,178 |
Source: FCC Voice Telephone Services Report
Top 5 US Cell Phone Companies
Most phone numbers are cell phones, and most cell phone numbers come from the top three United States wireless companies. Here are the top five US Cell Phone Companies in Q1 2025:
- Verizon - 146 million customers
- T-Mobile US - 131 million customers
- AT&T Mobility - 118 million customers
- Boost Mobile - 7 million customers
- U.S. Cellular - 4.4 million customers


