Reverse Phone Lookup by West Virginia Area Code
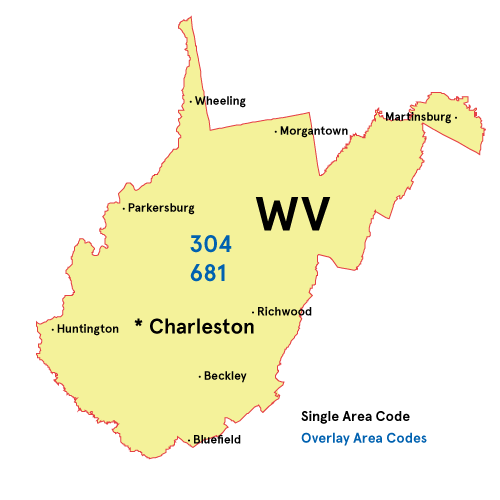
304 covers the Mountain State with 681 as an overlay across the same territory. One primary code, statewide coverage. There 's minimal variation to check in a table. Use our phone lookup tool above to get the owner 's name and city within West Virginia.

| Area Code |
Cities |
|
304 |
Charleston, Huntington, Parkersburg |
|
681 |
Charleston, Huntington, Parkersburg |
Important: Area codes do not guarantee the caller's current location. West Virginia allows number portability, and scammers often use "neighbor spoofing" to make calls appear local.
West Virginia Spam & Scam Number Lookup
Constant calls about Medicare benefits or health insurance are a plague in West Virginia. Identify the spammer instantly with our lookup tool and avoid the unwanted sales pitch.
Scams in West Virginia
Health/Medicare scams and Car Warranty calls are the most frequent issues.
| Area Code |
Unique Reported Scams |
| 681 |
Security/utility scams, Fake charity scams |
In 2024, West Virginia residents reported 8,767 fraud cases resulting in total losses of $27,018,386, with a median loss of $341 per victim. Received a fraudulent call or lost money to a phone scam? Report fraud or scam:
Spam Calls in West Virginia
In 2024, West Virginia residents filed 11,000 unwanted call complaints with the FTC, of which 5,234 were robocalls and 4,955 involved live callers. The most reported complaint topics were medical and prescriptions (1,138), reducing debt (576), imposters (549).
To reduce spam calls, register all your phone numbers at National Do Not Call Registry (donotcall.gov or call 1-888-382-1222 from the number you want to protect).
How West Virginia Reverse Call Lookup Works
A reverse phone number lookup in West Virginia identifies callers by searching open government databases for available name and address information. FTC Do Not Call and robocall complaint data and user-submitted spam flags fill in the picture. A useful step before answering or returning a call from a number you don't recognize.
- Enter the phone number, including the area code. West Virginia has used 304 for decades, with the newer 681 overlay added more recently.
- The search runs through publicly available government databases, FTC complaint files, and user spam reports.
- Owner details and spam history show up quickly. Two area codes for the whole state doesn't tell you much on its own, so the lookup adds what the number can't.
Can You Legally Do a Reverse Phone Lookup in West Virginia?
Yes, using reverse phone lookup services is completely legal in West Virginia when used for personal purposes like identifying unknown numbers or avoiding scam calls. That said, federal law under the Fair Credit Reporting Act (FCRA) prohibits using lookup results for hiring decisions, tenant screening, or determining credit eligibility.
FAQs
How do I remove my phone number from West Virginia directories?
West Virginia doesn't have a privacy law, but you can still ask to be removed from phone directories. Look for an opt-out form on each site or contact their support team to request removal.
How to tell if a West Virginia caller is a real business?
A phone number linked to a business name does not always mean the call is genuine. According to U.S. Census data, there are over 35,530 business establishments in West Virginia. To confirm a specific company exists, search the West Virginia Business Entity Search, the state’s official business entity registry.
Do most West Virginia residents use cell phones or landlines?
West Virginia has 1.7 million mobile subscriptions, 264,000 VoIP numbers, and 200,000 landlines.


