Reverse Phone Number Lookup in South Carolina
A reverse phone lookup in South Carolina helps you discover who's behind a phone number using open public databases from government sources. This number lookup provides name and address. Ideal for South Carolinians avoiding spam and fraud. Use this phone search to find out if unknown callers are fraudsters, old friends, or someone you'd rather engage or ignore.
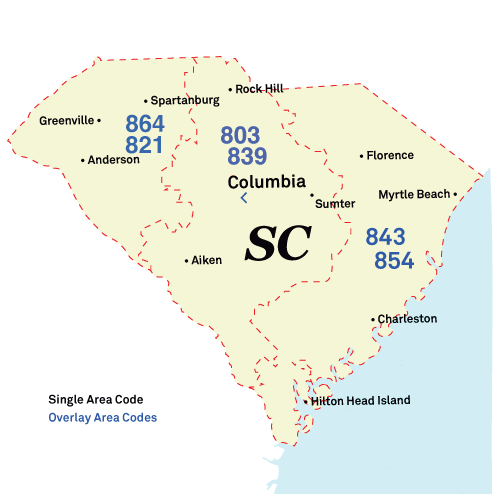
Reverse Phone Lookup by South Carolina Area Code
All South Carolina phone numbers consist of three parts: the three-digit Area Code,
the three-digit Prefix Code (also known as the exchange or central office code),
and the final four-digit line number. While the area code narrows down the
location to a large region, the prefix code can often specify the original city
or town where the number was registered.

Here's a complete list of South Carolina area codes:
Area Codes 803/839: Columbia, Rock Hill, Sumter
Location: The 803 and 839 area codes cover central South Carolina, including major cities like Columbia, Rock Hill, and Sumter.
Common Callers: South Carolina State government, Fort Jackson personnel, and BlueCross BlueShield of SC claims.
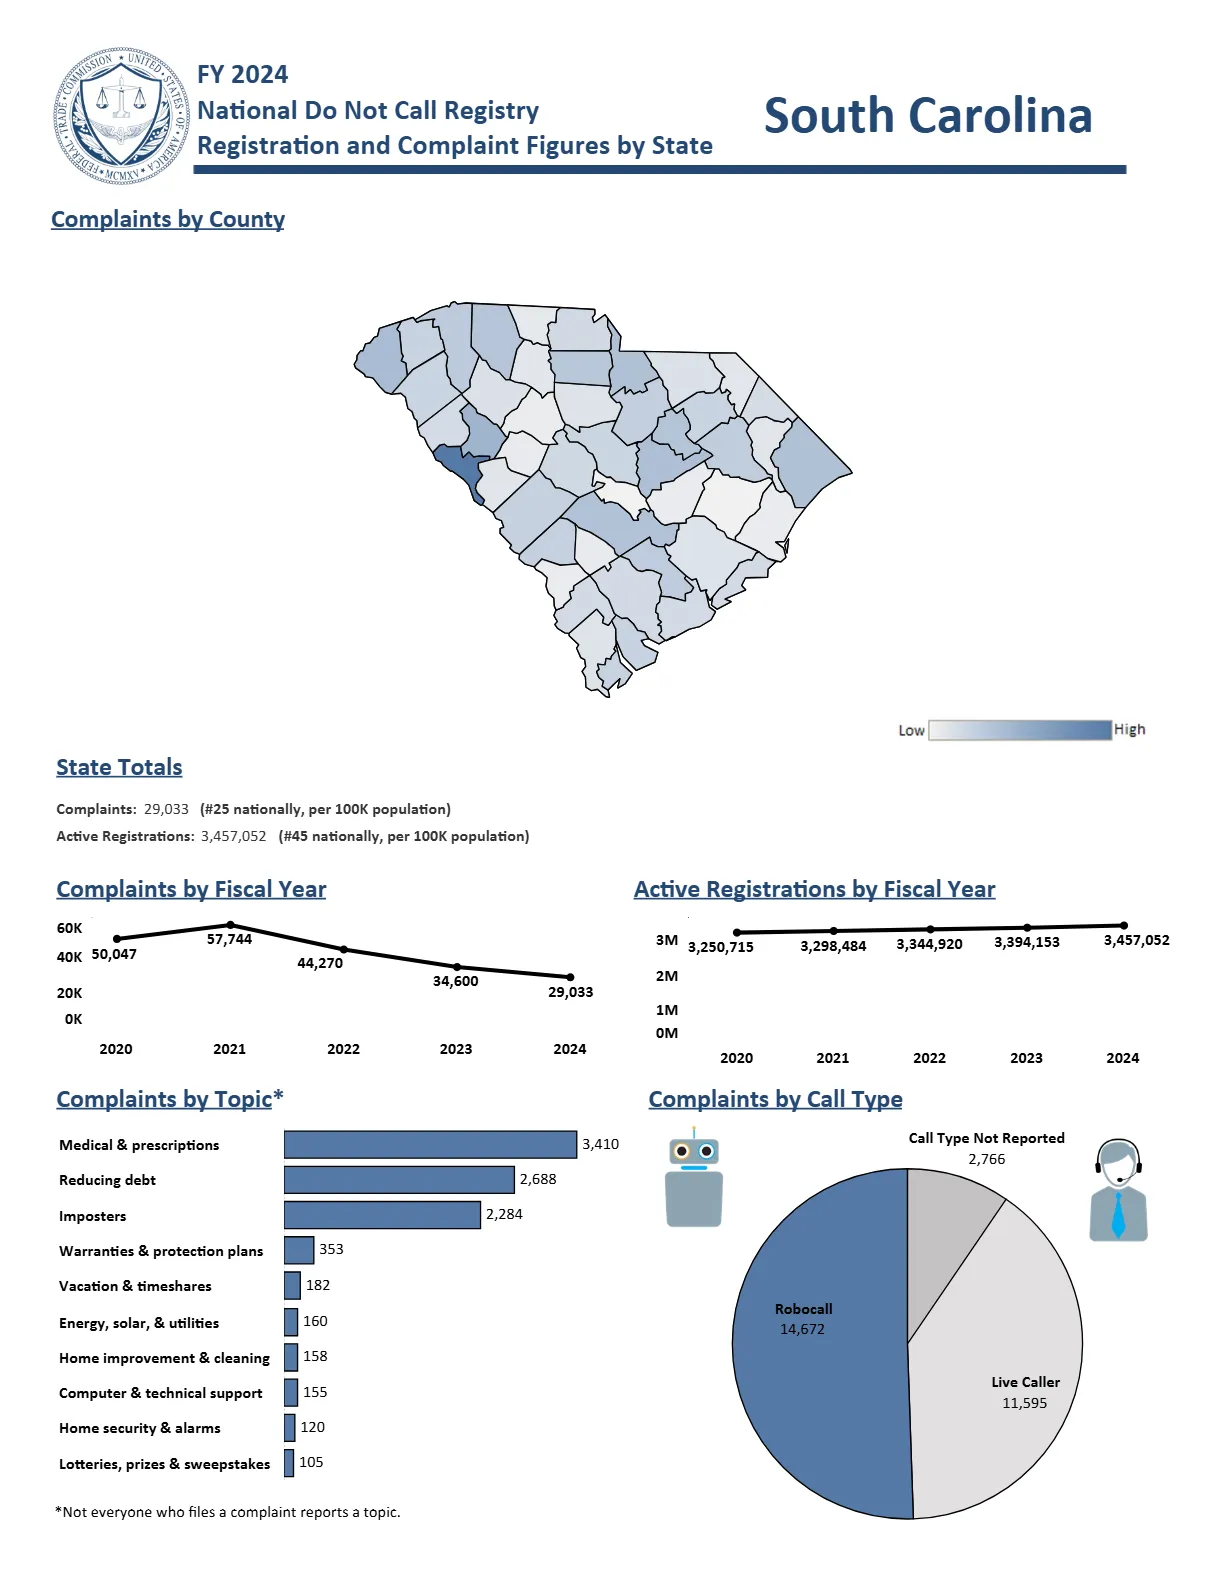
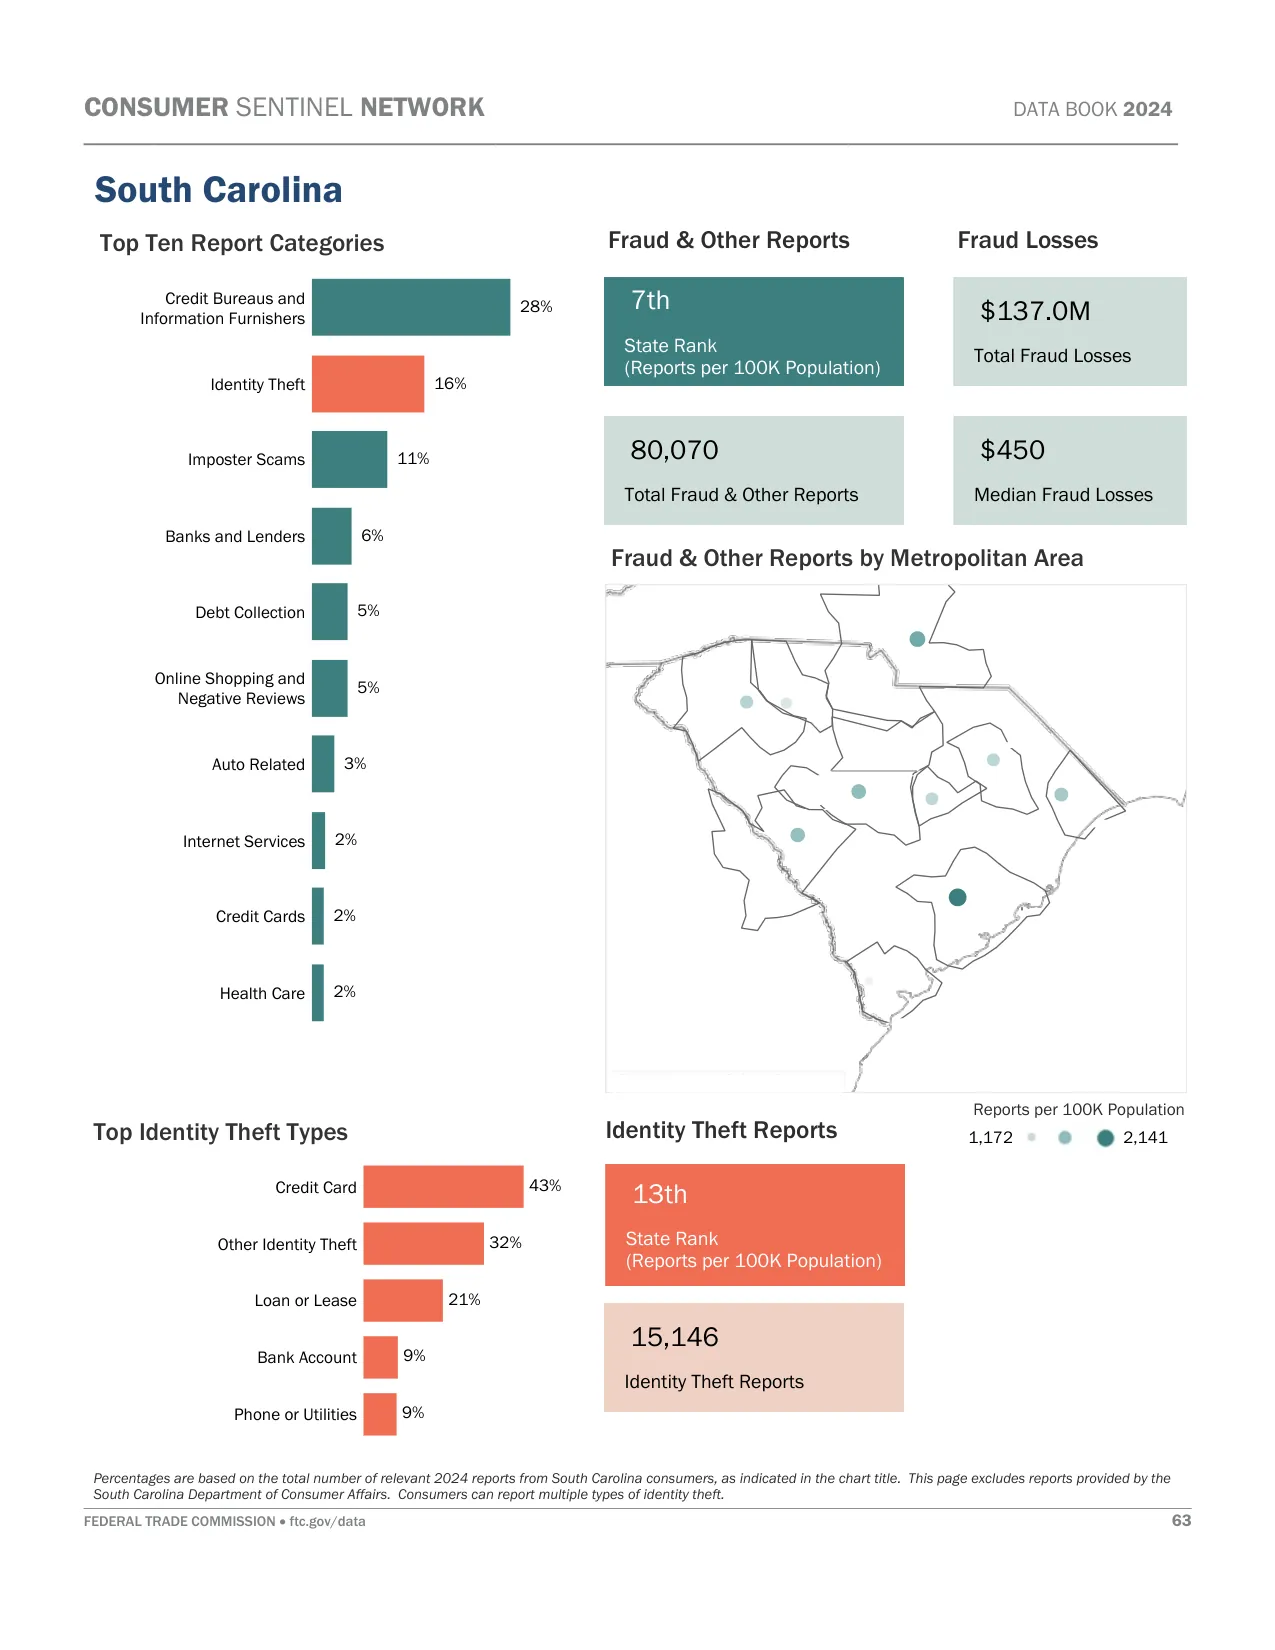
Scams and Spam Calls: The 803 and 839 area codes are targeted by the "Injured Grandson" scam and aggressive Magazine Subscription calls. Residents also face Fake Loan Approval/Advance Fee scams, Phishing Text Messages ("Smishing"), and Social Security Administration imposters.
Area Codes 843/854: Charleston, North Charleston, Mount Pleasant
Location: The 843 and 854 area codes cover eastern and coastal South Carolina, including major cities like Charleston, Myrtle Beach, and Florence.
Common Callers: Boeing South Carolina recruiters, MUSC Health appointment lines, and vacation rental agents.
Scams and Spam Calls: The 843 and 854 area codes experience Dominion Energy Shut-Off scams and Tidelands Health Billing impersonation. 854 reports Fake Federal Agent/Arrest Warrant scams and Middle-of-the-Night Medical Alarm robocalls, while 843 is dealing with aggressive "We Buy Houses" offers.
Area Codes 821/864: Greenville, Spartanburg, Anderson
Location: The 821 and 864 area codes cover the Upstate region of South Carolina, including major cities like Greenville, Spartanburg, and Anderson.
Common Callers: BMW Manufacturing plant HR, Clemson University alumni, and Prisma Health Upstate billing.
Scams and Spam Calls: The 821 and 864 area codes are targeted by Unsolicited Real Estate & Property texts and the harassing "Creepy Caller" (associated with number 864-621-5211). Residents also report Fake Process Server threats, Government Impersonation (IRS/SSN), and Medicare Equipment scams.
Important: Area codes show where a number was originally assigned, not where the caller currently lives. Federal number portability laws
allow people to keep their phone numbers when moving or switching carriers. Use our reverse phone lookup tool above to get detailed phone number owner information.
For latest South Carolina phone numbering regulations, contact Kari Munn (ORS) at the South Carolina PSC via [email protected] or 803-737-0821.
South Carolina Phone Numbers
South Carolina has approximately 6.6 million active phone numbers. Cell phones make up the majority with 5.5 million users, while traditional landlines have significantly decreased to around 312,000 connections statewide. Internet phone services account for about 749,000 numbers.
This means that when you search a South Carolina phone number, it's most likely a cell phone. The shift away from landlines indicates that newer phone numbers may be harder to trace compared to older landline numbers that typically had more readily available public information.
South Carolina Voice Subscriptions (in thousands):
| Service Type |
June 2023 |
Dec 2023 |
June 2024 |
| Mobile telephony |
5,397 |
5,511 |
5,531 |
| Local exchange telephone service |
403 |
370 |
312 |
| VoIP subscriptions |
800 |
772 |
749 |
| Total |
6,600 |
6,653 |
6,592 |
Source: FCC Voice Telephone Services Report
Top 5 US Cell Phone Companies
Most phone numbers are cell phones, and most cell phone numbers come from the top three United States wireless companies. Here are the top five US Cell Phone Companies in Q1 2025:
- Verizon - 146 million customers
- T-Mobile US - 131 million customers
- AT&T Mobility - 118 million customers
- Boost Mobile - 7 million customers
- U.S. Cellular - 4.4 million customers


