Reverse Phone Lookup by South Carolina Area Code
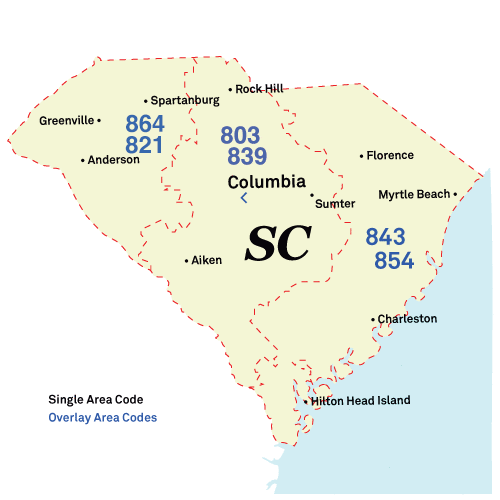
Columbia 's 803, Charleston 's 843/854, Greenville 's 864, with 839 overlaying several areas. The table below maps codes to cities across the Palmetto State. Beach communities and upstate metros share codes across wide territories. Use the phone lookup tool to get the owner 's name and address.

| Area Code |
Cities |
|
803 |
Columbia, Rock Hill, Sumter |
|
821 |
|
|
839 |
Columbia, Rock Hill, Sumter |
|
843 |
Charleston, North Charleston, Mount Pleasant |
|
854 |
Charleston, North Charleston, Mount Pleasant |
|
864 |
Greenville, Spartanburg, Anderson |
Important: Area codes do not guarantee the caller's current location. South Carolina allows number portability, and scammers often use "neighbor spoofing" to make calls appear local.
South Carolina Spam & Scam Number Lookup
Data indicates a rise in fake billing and "home buying" texts flooding South Carolina phones. Cross-reference the number with our spam logs to distinguish real business inquiries from financial fraud.
Scams in South Carolina
Fake Loan/Fee scams and Medicare brace scams are widely reported.
| Area Code |
Unique Reported Scams |
| 839 |
Injured grandson scams, Magazine subscription scams |
| 854 |
Medical alarm robocalls, Bank phishing texts |
In 2024, South Carolina residents reported 31,929 fraud cases resulting in total losses of $137,049,006, with a median loss of $450 per victim. Received a fraudulent call or lost money to a phone scam? Report fraud or scam:
Spam Calls in South Carolina
In 2024, South Carolina residents filed 29,033 unwanted call complaints with the FTC, of which 14,672 were robocalls and 11,595 involved live callers. The most reported complaint topics were medical and prescriptions (3,410), reducing debt (2,688), imposters (2,284).
To reduce spam calls, register all your phone numbers at National Do Not Call Registry (donotcall.gov or call 1-888-382-1222 from the number you want to protect).
How South Carolina Phone Search Works
A phone number search in South Carolina draws from open public government databases to find available name and address information for any phone number. FTC complaint data and user-submitted scam reports round out the results. Enough for South Carolinians to determine whether an unknown caller is a scammer, a forgotten contact, or someone not worth engaging with.
- Enter the number, including the area code. Charleston uses 843, Columbia is 803, and Greenville uses 864.
- We check public records, government databases, FTC complaints, and community reports.
- You'll see available owner info and any reports from other users. If the number has been flagged as spam before, that shows up right away.
Is It Legal to Do a Reverse Phone Lookup in South Carolina?
Reverse phone lookup is legal in South Carolina for everyday personal use. Whether you're checking an unknown caller, verifying a contact, or spotting potential fraud, you're within your rights. Keep in mind that the Fair Credit Reporting Act (FCRA) restricts using this information for employment, housing, or credit decisions.
FAQs
How do I remove my number from phone lookup sites in South Carolina?
South Carolina doesn't have a privacy law, but you can still ask to be removed from phone lookup sites. Go to each site's privacy page and fill out their opt-out or removal form.
How to confirm a South Carolina business caller is real?
Getting a business name from a phone lookup is helpful, but verification is key. With over 120,769 business establishments in South Carolina according to Census data, confirming the company through the South Carolina Business Name Search is the safest approach.
Do most South Carolina residents use mobile phones or landlines?
South Carolina has 5.5 million mobile subscriptions, 749,000 VoIP numbers, and 312,000 landlines.


