Reverse Phone Number Lookup in Nebraska
Reverse phone lookup in Nebraska helps residents discover who owns any phone number using open government databases. Fast and accurate results include name and address. Perfect for Nebraskans wanting to avoid scams or reconnect with old contacts. This number lookup service helps decide whether an unsolicited call is from a scammer, acquaintance, or spam caller.
Reverse Phone Lookup by Nebraska Area Code
All Nebraska phone numbers consist of three parts: the three-digit Area Code,
the three-digit Prefix Code (also known as the exchange or central office code),
and the final four-digit line number. While the area code narrows down the
location to a large region, the prefix code can often specify the original city
or town where the number was registered.

Here's a complete list of Nebraska area codes:
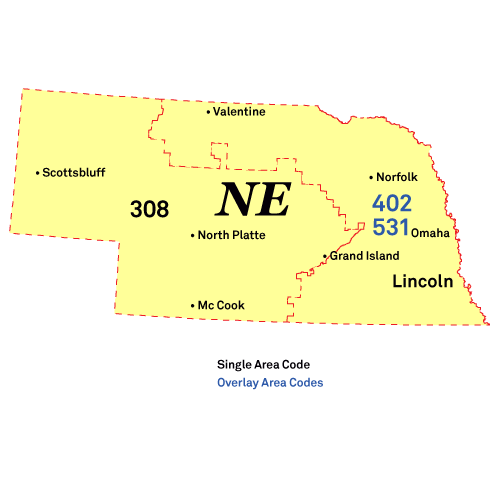
Area Code 308: Grand Island, Kearney, North Platte
Location: The 308 area code covers western and central Nebraska, including major cities like Grand Island, Kearney, and North Platte.
Common Callers: Union Pacific rail dispatchers (Bailey Yard), meatpacking plant recruiters (JBS), and agricultural equipment sales.
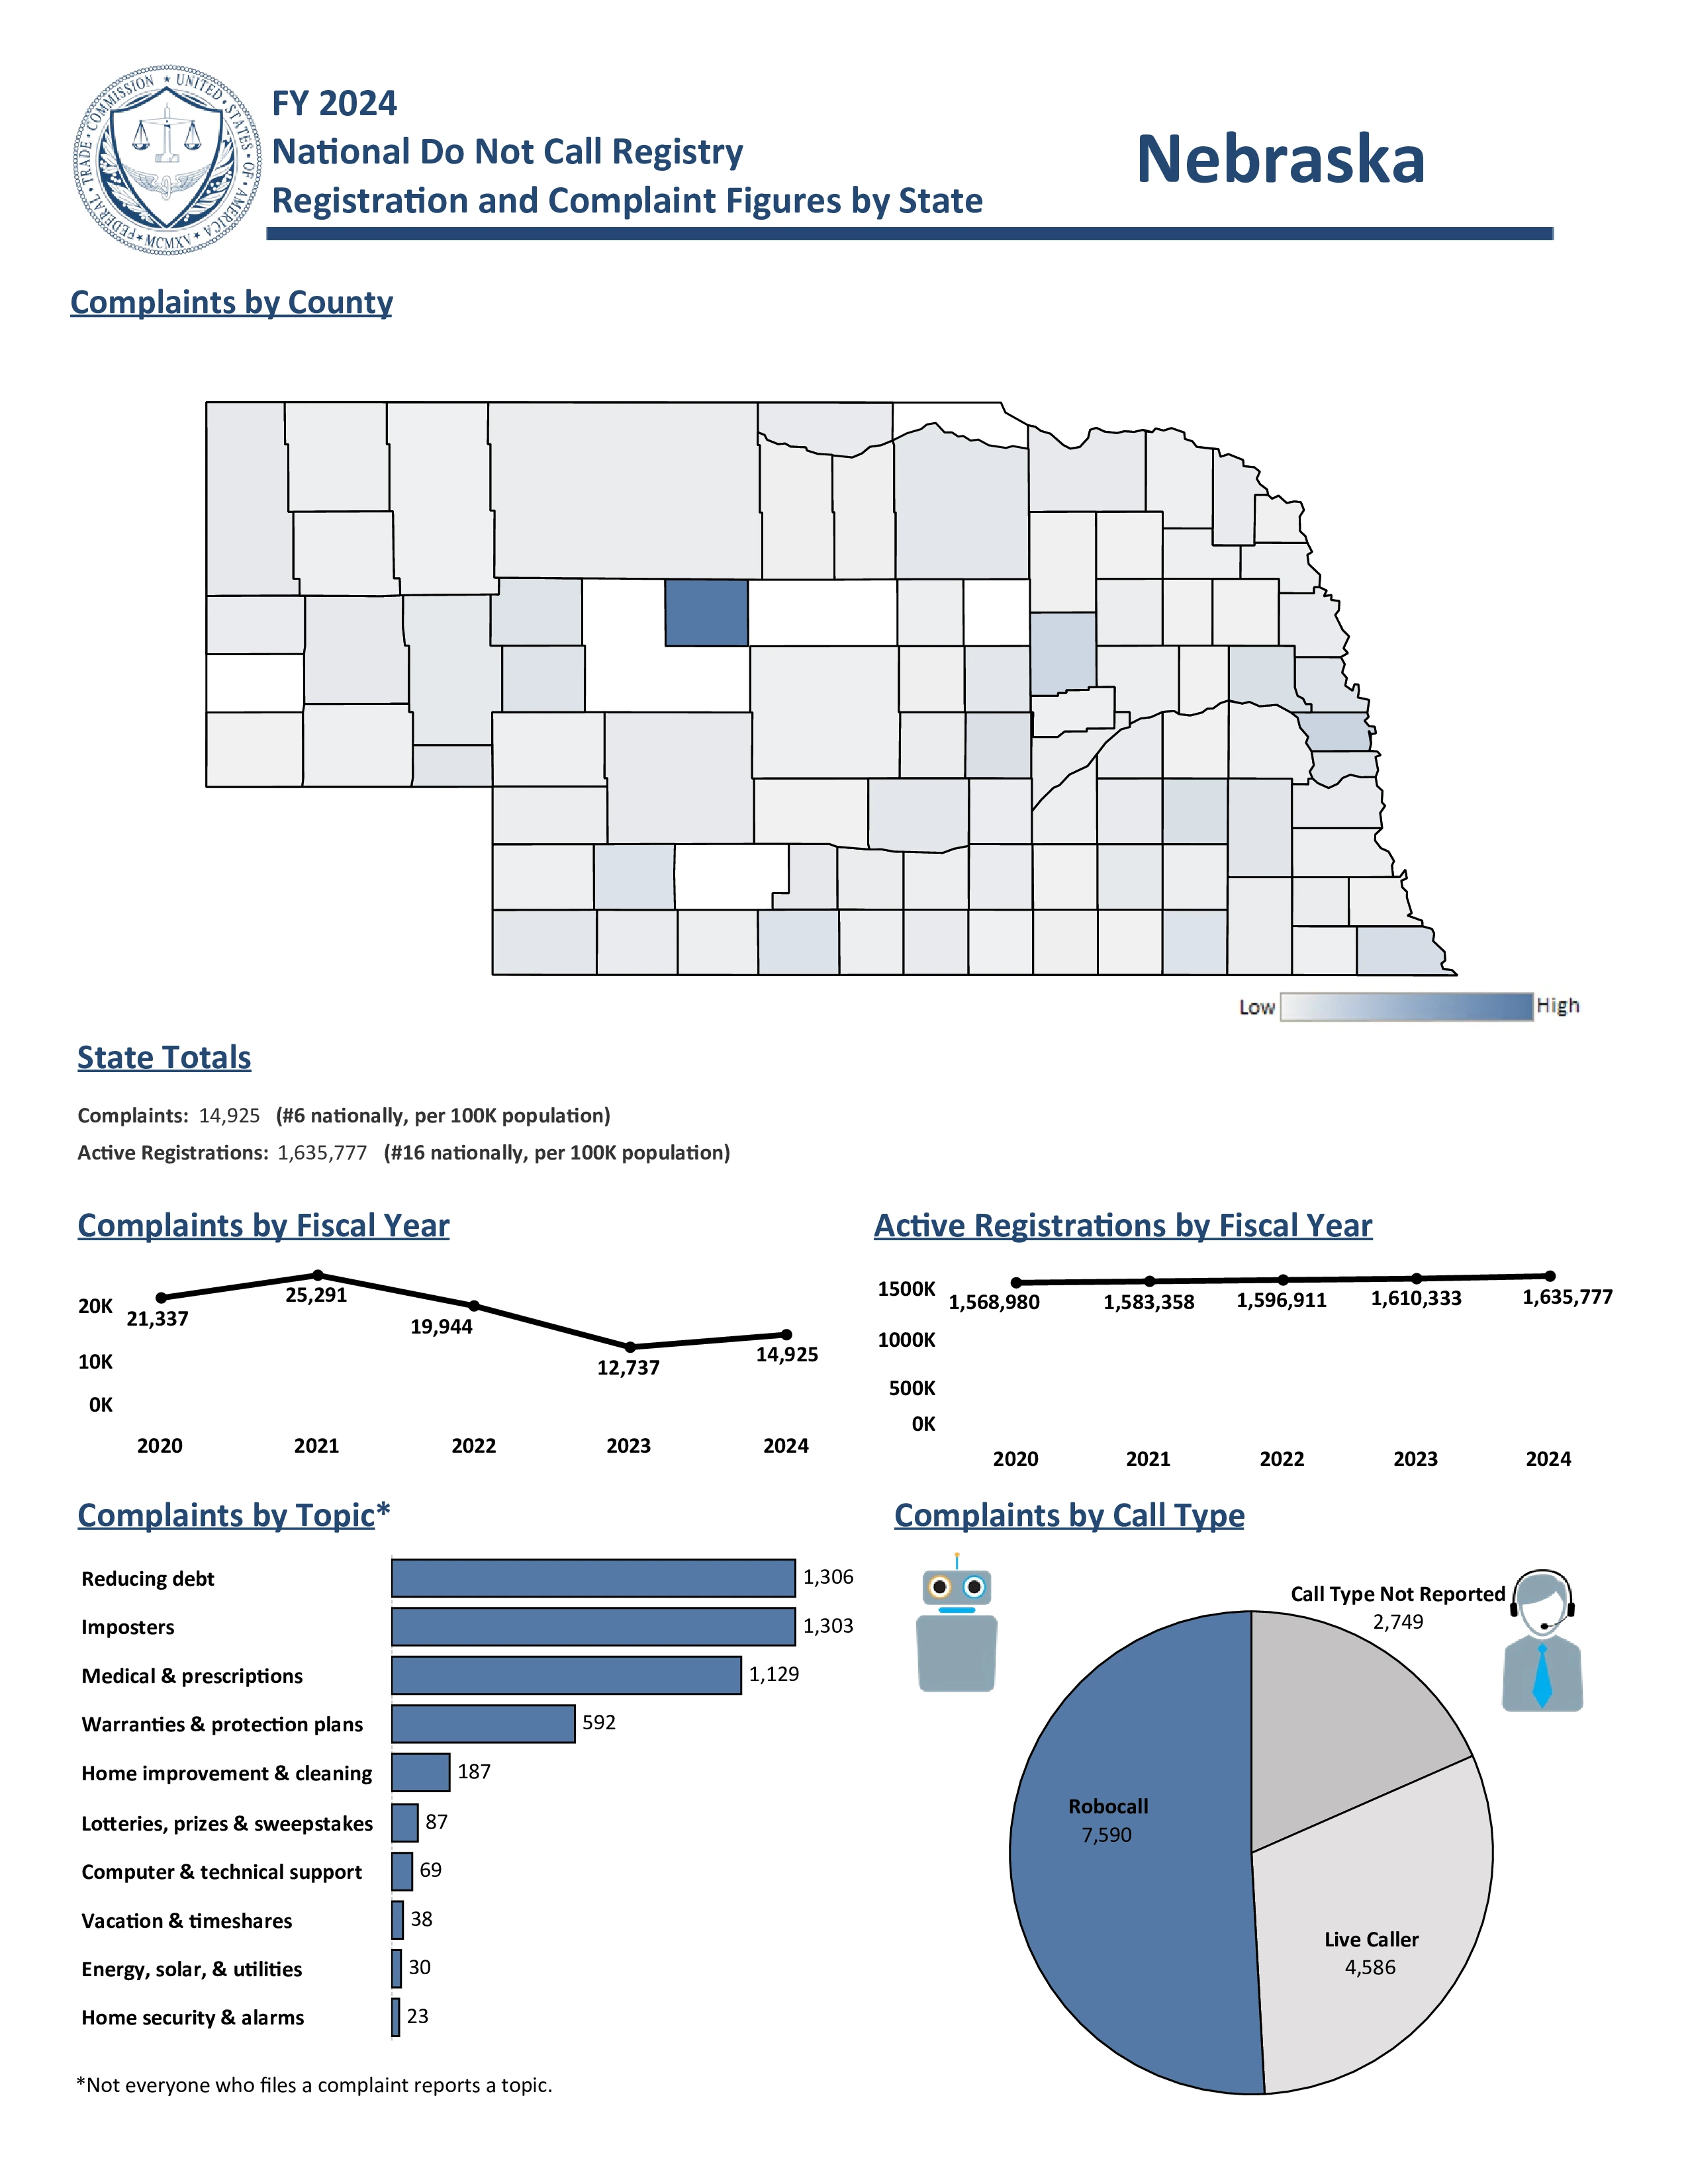
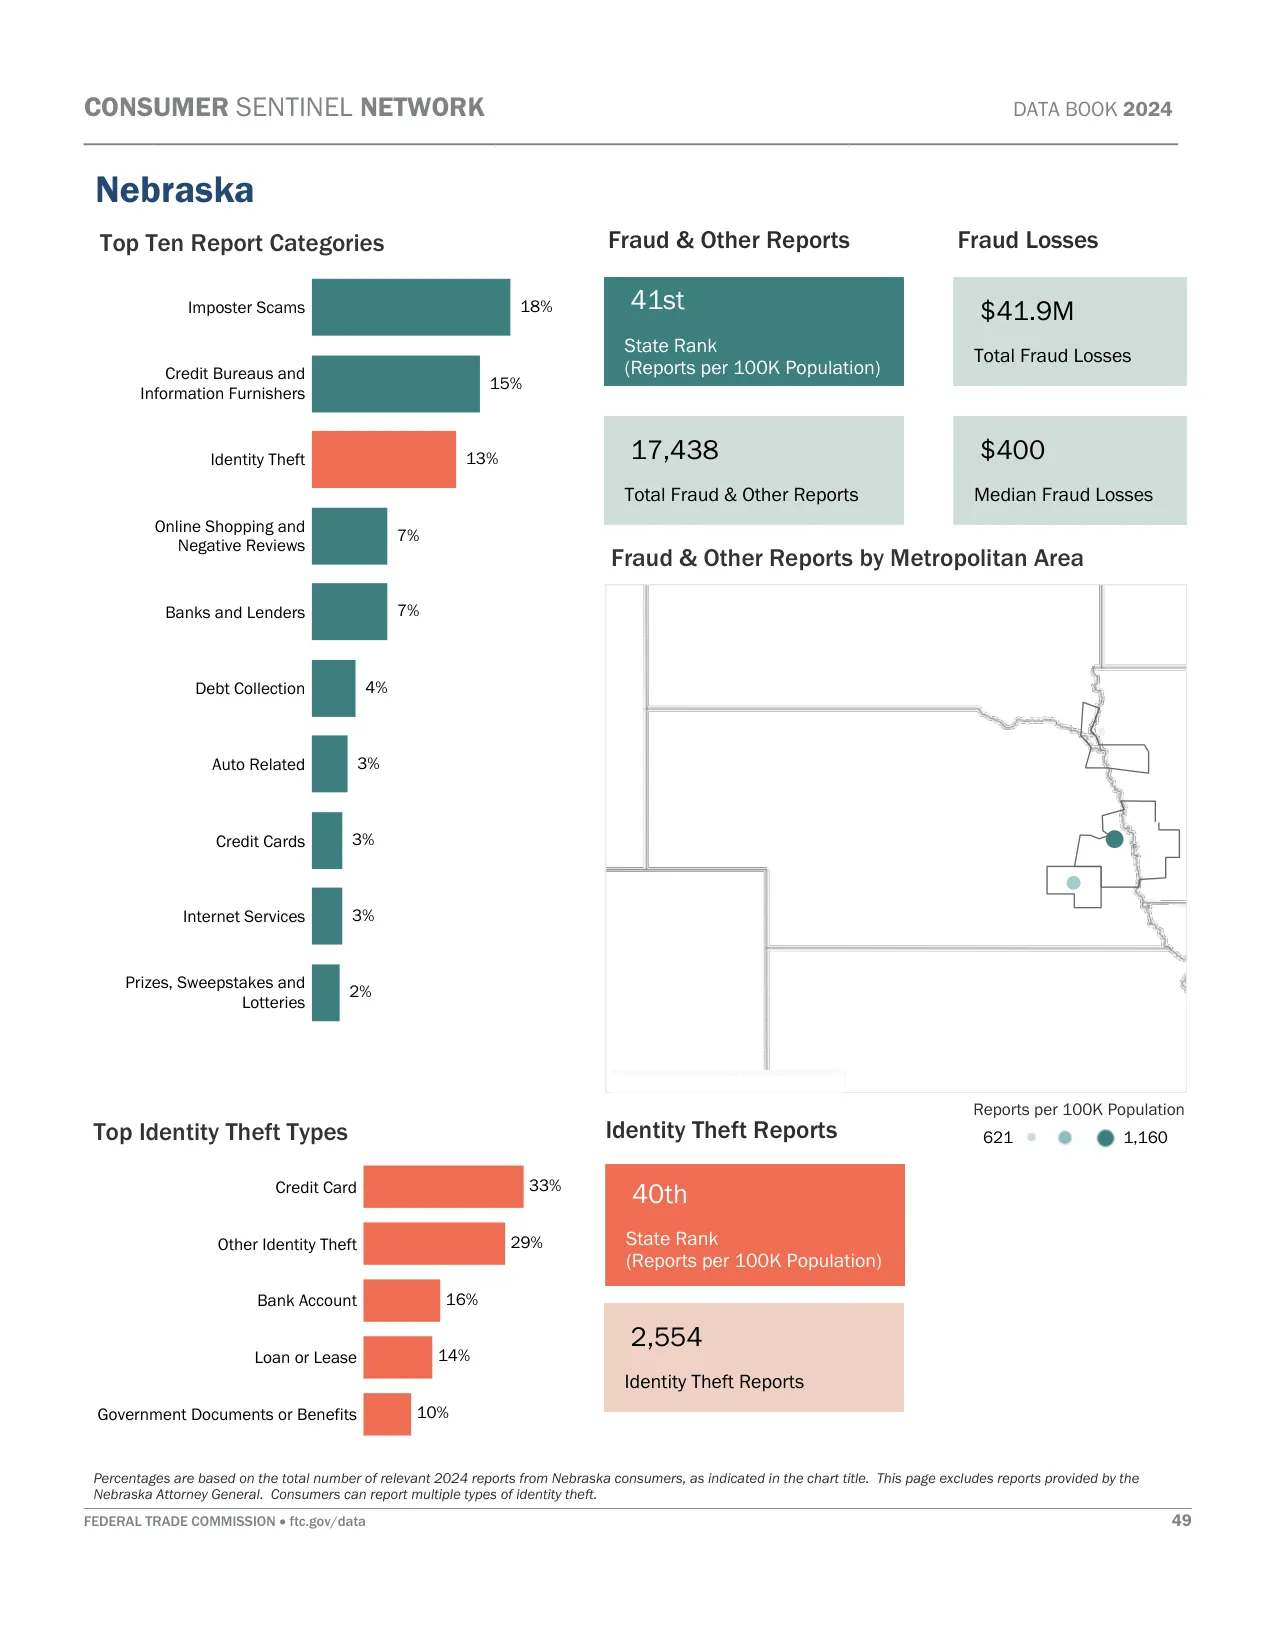
Scams and Spam Calls: The 308 area code deals with Private Sale Upfront Fee scams and Tech Support "Account Breach" fraud. "Grandson in Jail" Emergency scams are common, as are Aggressive Auto Warranty Expiration calls and Medicare scams.
Area Codes 402/531: Omaha, Lincoln, Bellevue
Location: The 402 and 531 area codes cover eastern Nebraska, including major cities like Omaha, Lincoln, and Bellevue.
Common Callers: Berkshire Hathaway admin, Mutual of Omaha insurance agents, UNL staff, and Offutt AFB (USSTRATCOM) personnel.
Scams and Spam Calls: The 402 and 531 area codes report Cable & Internet Provider Discount scams and Fake Bank & Credit Card Fraud alerts. Unsolicited Real Estate "Cash Offers" are frequent, along with Fake Police & Firefighter Donation pleas and Phantom Debt threats.
Important: Area codes show where a number was originally assigned, not where the caller currently lives. Federal number portability laws
allow people to keep their phone numbers when moving or switching carriers. Use our reverse phone lookup tool above to get detailed phone number owner information.
For latest Nebraska phone numbering regulations, contact Cullen Robbins at the Nebraska PSC via [email protected] or 402-471-0230.
Nebraska Phone Numbers
Nebraska has approximately 2.8 million active phone numbers. Cell phones are the most common with about 2.2 million users, while traditional landlines are declining with only 181,000 connections. Internet phone services account for roughly 373,000 numbers.
This indicates that most phone numbers you encounter in Nebraska are likely cell phones. The decrease in landlines means that tracing newer phone numbers can be more challenging compared to older landline numbers, which often had more readily available public information.
Nebraska Voice Subscriptions (in thousands):
| Service Type |
June 2023 |
Dec 2023 |
June 2024 |
| Mobile telephony |
2,153 |
2,190 |
2,219 |
| Local exchange telephone service |
206 |
194 |
181 |
| VoIP subscriptions |
360 |
358 |
373 |
| Total |
2,719 |
2,742 |
2,773 |
Source: FCC Voice Telephone Services Report
Top 5 US Cell Phone Companies
Most phone numbers are cell phones, and most cell phone numbers come from the top three United States wireless companies. Here are the top five US Cell Phone Companies in Q1 2025:
- Verizon - 146 million customers
- T-Mobile US - 131 million customers
- AT&T Mobility - 118 million customers
- Boost Mobile - 7 million customers
- U.S. Cellular - 4.4 million customers


