Reverse Phone Number Lookup in North Dakota
A reverse phone lookup in North Dakota helps residents identify callers using public databases from government sources. Get the owner's name and address. A trusted service for staying safe in the Peace Garden State. This phone number lookup helps answer "who called me" and screen calls to avoid potential scammers.
Reverse Phone Lookup by North Dakota Area Code
All North Dakota phone numbers consist of three parts: the three-digit Area Code,
the three-digit Prefix Code (also known as the exchange or central office code),
and the final four-digit line number. While the area code narrows down the
location to a large region, the prefix code can often specify the original city
or town where the number was registered.

Here's a complete list of North Dakota area codes:
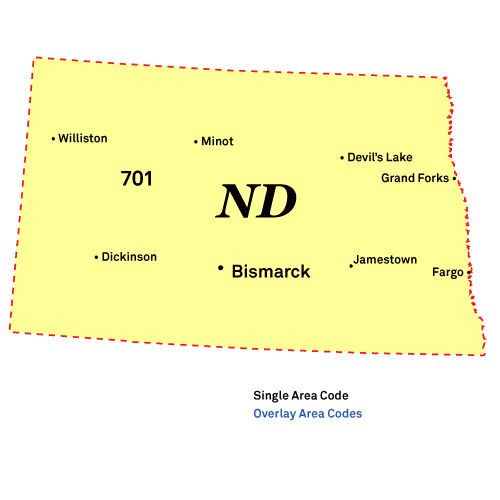
Area Code 701: Fargo, Bismarck, Grand Forks
Location: The 701 area code covers the entire state of North Dakota, including major cities like Fargo, Bismarck, and Grand Forks.
Common Callers: Sanford Health appointment lines, Bobcat Company sales, and Bakken oil field dispatchers.
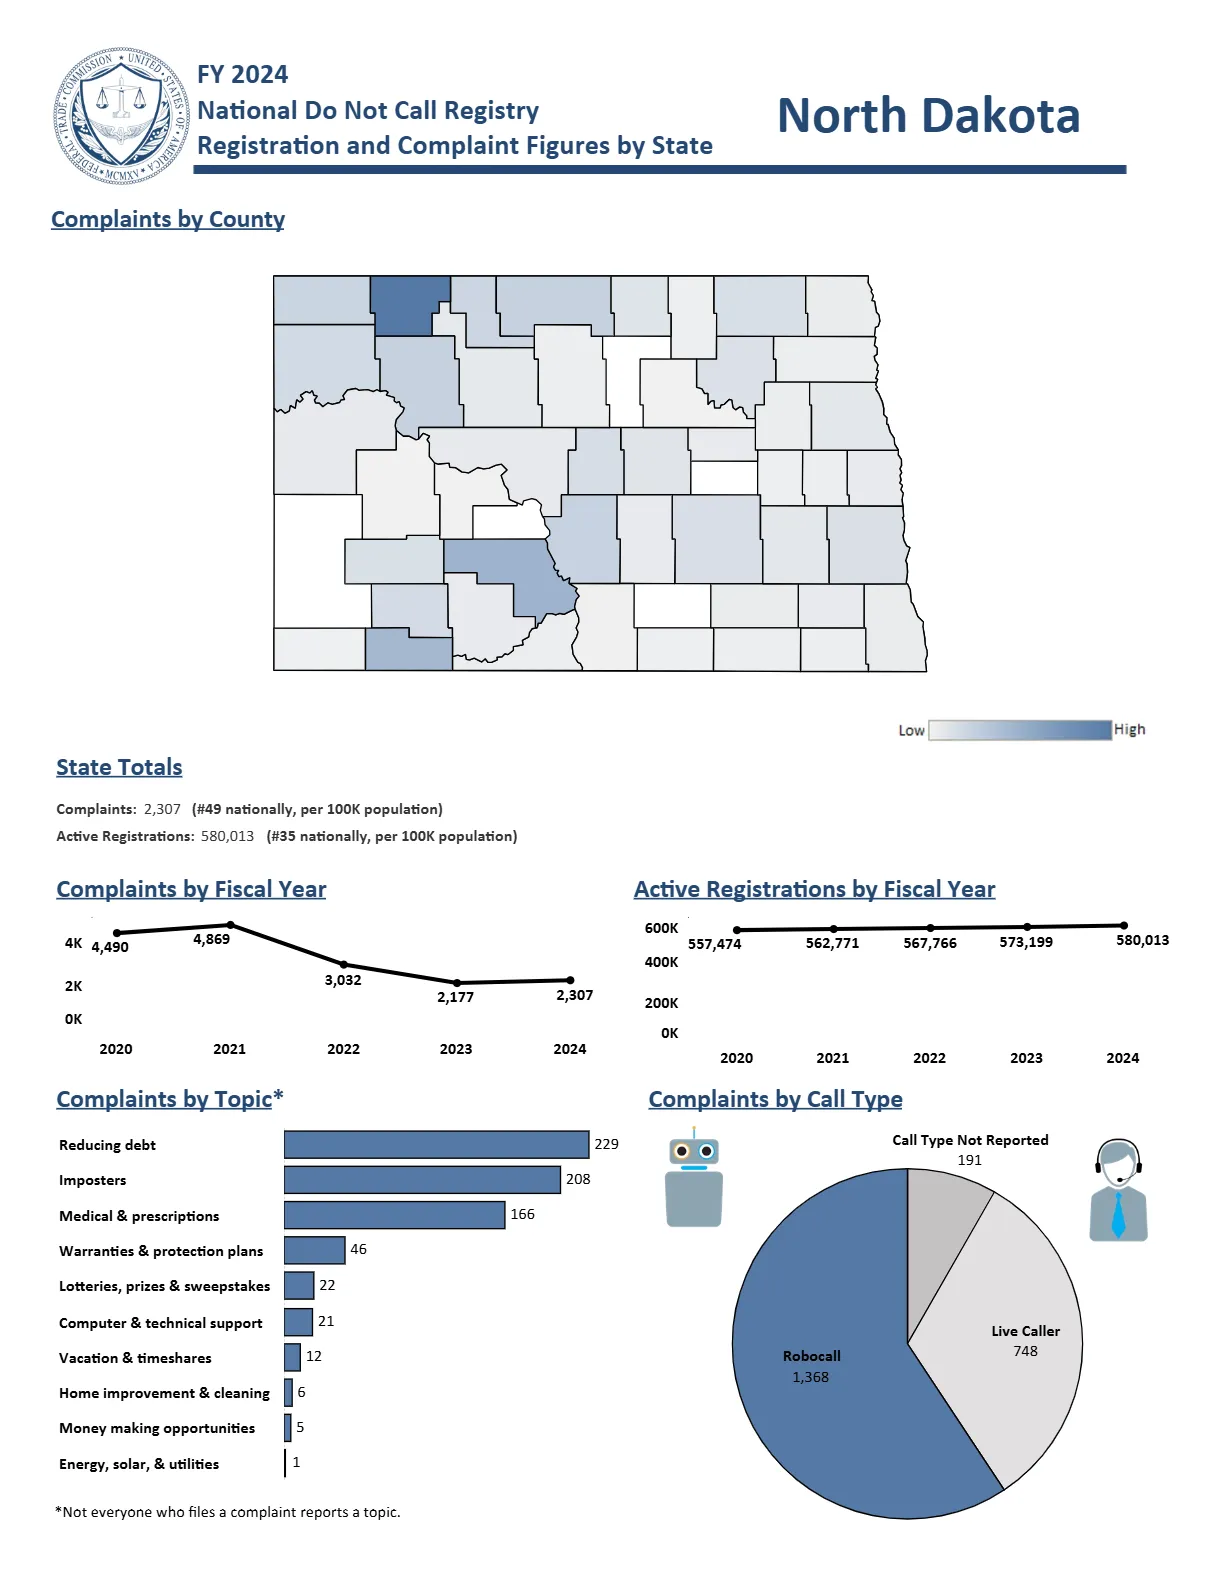
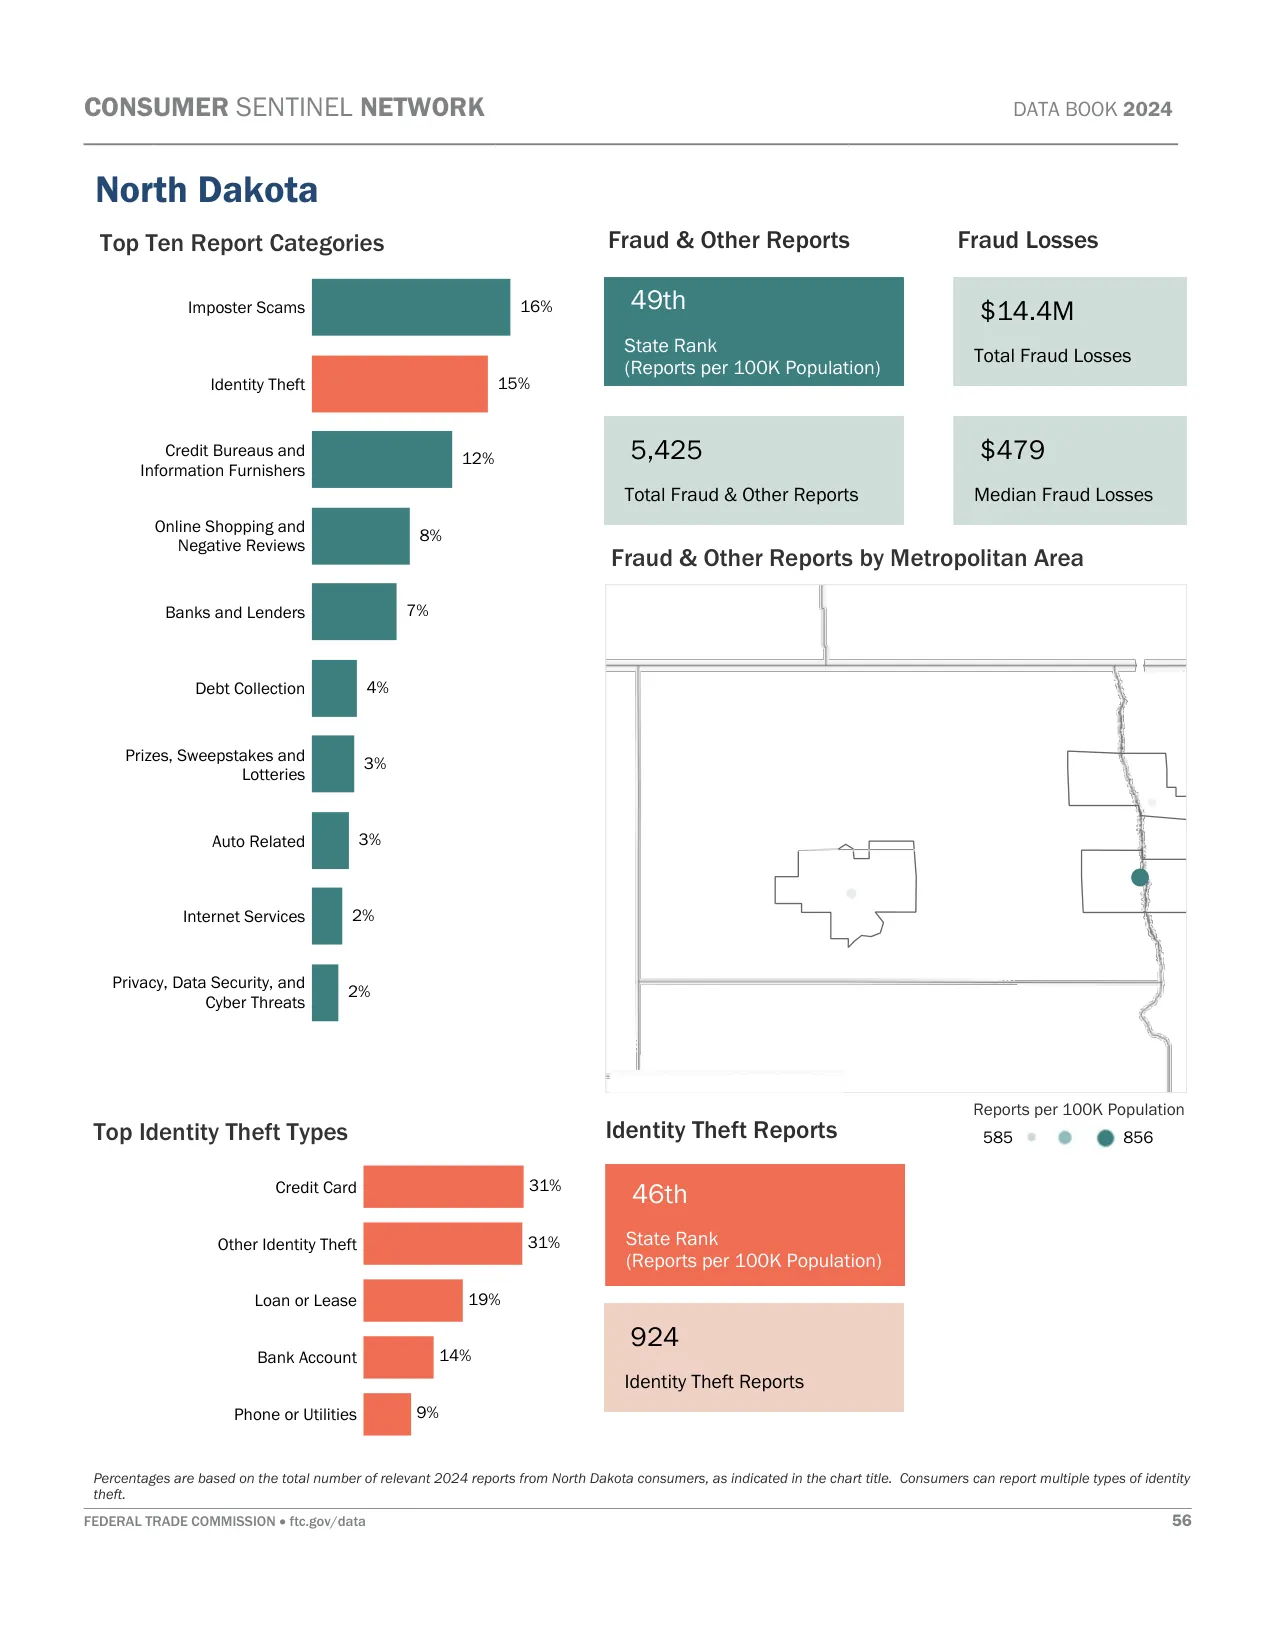
Scams and Spam Calls: The 701 area code is dealing with the "Art" Insurance Application scam and Aggressive Catalytic Converter Buyer scams. The Amazon Compromised Account scam is reported, along with the Computer Service Renewal scam and Google Business Listing fraud.
Important: Area codes show where a number was originally assigned, not where the caller currently lives. Federal number portability laws
allow people to keep their phone numbers when moving or switching carriers. Use our reverse phone lookup tool above to get detailed phone number owner information.
For latest North Dakota phone numbering regulations, contact Victor Schock at the North Dakota PSC via [email protected] or 701-328-3397.
North Dakota Phone Numbers
North Dakota has approximately 1.1 million active phone numbers. Cell phones are the most popular option with nearly 900,000 users, while traditional landlines are less common with just under 100,000 connections statewide. Internet phone services account for about 100,000 numbers.
This means that when you search a North Dakota phone number, it's highly likely a cell phone. The continued decrease in landlines suggests that newer phone numbers are typically more difficult to trace compared to older landline numbers that had more readily available public information.
North Dakota Voice Subscriptions (in thousands):
| Service Type |
June 2023 |
Dec 2023 |
June 2024 |
| Mobile telephony |
859 |
878 |
896 |
| Local exchange telephone service |
104 |
100 |
97 |
| VoIP subscriptions |
92 |
100 |
101 |
| Total |
1,055 |
1,078 |
1,094 |
Source: FCC Voice Telephone Services Report
Top 5 US Cell Phone Companies
Most phone numbers are cell phones, and most cell phone numbers come from the top three United States wireless companies. Here are the top five US Cell Phone Companies in Q1 2025:
- Verizon - 146 million customers
- T-Mobile US - 131 million customers
- AT&T Mobility - 118 million customers
- Boost Mobile - 7 million customers
- U.S. Cellular - 4.4 million customers


