Reverse Phone Number Lookup in North Carolina
Reverse phone lookup in North Carolina reveals who owns any unknown number using public government databases. North Carolinians can access registered name and address information quickly and legally. This number search helps identify potential scammers, verify business contacts, and determine whether unknown calls are from legitimate sources before deciding to answer.
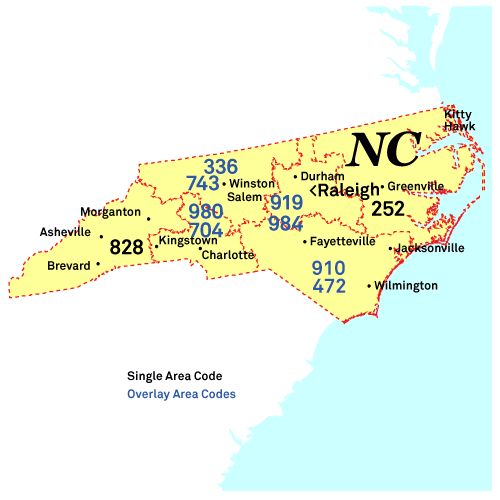
Reverse Phone Lookup by North Carolina Area Code
All North Carolina phone numbers consist of three parts: the three-digit Area Code,
the three-digit Prefix Code (also known as the exchange or central office code),
and the final four-digit line number. While the area code narrows down the
location to a large region, the prefix code can often specify the original city
or town where the number was registered.

Here's a complete list of North Carolina area codes:
Area Code 252: Greenville, Rocky Mount, Wilson
Location: The 252 area code covers northeastern North Carolina, including major cities like Greenville, New Bern, and Rocky Mount.
Common Callers: ECU Health appointment lines, Marine Corps Air Station Cherry Point admin, and Outer Banks vacation rental agents.
Scams and Spam Calls: The 252 area code is targeted by Business Printer & "Google Listing" scams and Fake Charity & Law Enforcement Donation scams. Social Security Administration (SSA) Arrest scams are common, as are Medicare & Medical Equipment schemes and Publishers Clearing House (PCH) fraud.
Area Codes 336/743: Greensboro, Winston-Salem, High Point
Location: The 336 and 743 area codes cover the Piedmont Triad region of North Carolina, including major cities like Greensboro, Winston-Salem, and High Point.
Common Callers: Wake Forest Baptist Health scheduling, Hanesbrands corporate, and Volvo Trucks support.
Scams and Spam Calls: The 336 and 743 area codes see Medicare "Plastic Card" Replacement scams and AI Voice Business & Property scams. Fake Amazon Job Offers are reported, along with Aggressive Fake Debt Collector threats and Fake Police & Veteran Charity scams.
Area Codes 472/910: Fayetteville, Wilmington, Jacksonville
Location: The 472 and 910 area codes cover southeastern North Carolina, including major cities like Fayetteville, Wilmington, and Jacksonville.
Common Callers: Fort Liberty (Army) housing, Camp Lejeune (Marines) admin, and PPD (Thermo Fisher) clinical trial recruiters.
Scams and Spam Calls: The 472 and 910 area codes deal with Vague "Patrick" Property Buyer scams and Medicare & Medical Supply scams. Social Security & Arrest Warrant scams are frequent, as are Fake Debt & Legal Action threats and Amazon Purchase scams.
Area Codes 704/980: Charlotte, Concord, Gastonia
Location: The 704 and 980 area codes cover the greater Charlotte metropolitan area in North Carolina, including major cities like Charlotte, Gastonia, and Concord.
Common Callers: Bank of America fraud departments, Wells Fargo support, Atrium Health nurses, and Lowe's corporate.
Scams and Spam Calls: The 704 and 980 area codes encounter Duke Energy Impersonation scams and Aggressive "We Buy Houses" Cash Offer scams. Fake Microsoft & Tech Support scams are reported, along with Fake Prize & Car Giveaway scams and Legal/Debt threats.
Area Code 828: Asheville, Hickory, Lenoir
Location: The 828 area code covers western North Carolina, including major cities like Asheville, Hickory, and Boone.
Common Callers: Mission Health patient advocates, Harrah's Cherokee Casino hosts, and Biltmore tourism sales.
Scams and Spam Calls: The 828 area code is targeted by Publishers Clearing House (PCH) Impersonation scams and Tech Support and Retail scams. Social Security Suspension threats are common, as are Aggressive Vehicle Warranty scams and Fake Lawsuit/Arrest threats.
Area Codes 919/984: Raleigh, Durham, Cary
Location: The 919 and 984 area codes cover the Research Triangle region of North Carolina, including major cities like Raleigh, Durham, and Cary.
Common Callers: Duke Health/UNC Health scheduling, NC State government, and tech recruiters (Cisco/SAS/Lenovo).
Scams and Spam Calls: The 919 and 984 area codes report the "Bethany" All-Cash Home Offer scam and Unsolicited Account Confirmation texts. Fraudulent Police & First Responder Donations are common, along with "Can You Hear Me?" Voice Signature scams and Utility Company Impersonation.
Important: Area codes show where a number was originally assigned, not where the caller currently lives. Federal number portability laws
allow people to keep their phone numbers when moving or switching carriers. Use our reverse phone lookup tool above to get detailed phone number owner information.
For latest North Carolina phone numbering regulations, contact Nathan Barber at the North Carolina UC via [email protected] or 919-733-0848.
North Carolina Phone Numbers
North Carolina has approximately 14.1 million active phone numbers. Cell phones are the dominant type with 11.8 million users, while traditional landlines are declining with 534,000 connections statewide. Internet phone services account for about 1.8 million numbers.
This indicates that when you search a North Carolina phone number, it's highly likely to be a cell phone. The decreasing use of landlines suggests that newer phone numbers might be more challenging to trace compared to older landline numbers with more readily available public information.
North Carolina Voice Subscriptions (in thousands):
| Service Type |
June 2023 |
Dec 2023 |
June 2024 |
| Mobile telephony |
11,484 |
11,660 |
11,774 |
| Local exchange telephone service |
652 |
593 |
534 |
| VoIP subscriptions |
1,922 |
1,853 |
1,823 |
| Total |
14,058 |
14,106 |
14,131 |
Source: FCC Voice Telephone Services Report
Top 5 US Cell Phone Companies
Most phone numbers are cell phones, and most cell phone numbers come from the top three United States wireless companies. Here are the top five US Cell Phone Companies in Q1 2025:
- Verizon - 146 million customers
- T-Mobile US - 131 million customers
- AT&T Mobility - 118 million customers
- Boost Mobile - 7 million customers
- U.S. Cellular - 4.4 million customers


