Reverse Phone Number Lookup in Montana
A reverse phone lookup in Montana reveals who is calling from an unknown number by searching public databases from government records. Get the owner's name, address, and other available details. A critical tool for Montanans in rural and urban areas. This reverse search helps answer "who called me" and make informed decisions about answering or blocking unfamiliar calls.
Reverse Phone Lookup by Montana Area Code
All Montana phone numbers consist of three parts: the three-digit Area Code,
the three-digit Prefix Code (also known as the exchange or central office code),
and the final four-digit line number. While the area code narrows down the
location to a large region, the prefix code can often specify the original city
or town where the number was registered.

Here's a complete list of Montana area codes:
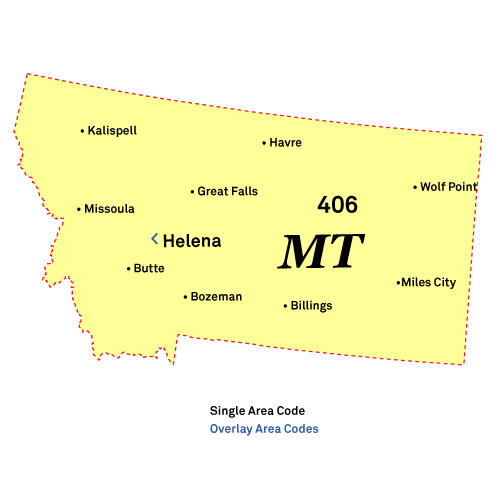
Area Code 406: Billings, Missoula, Great Falls
Location: The 406 area code covers the entire state of Montana, including major cities like Billings, Missoula, and Great Falls.
Common Callers: National Park Service rangers, Billings Clinic schedulers, and university alumni associations.
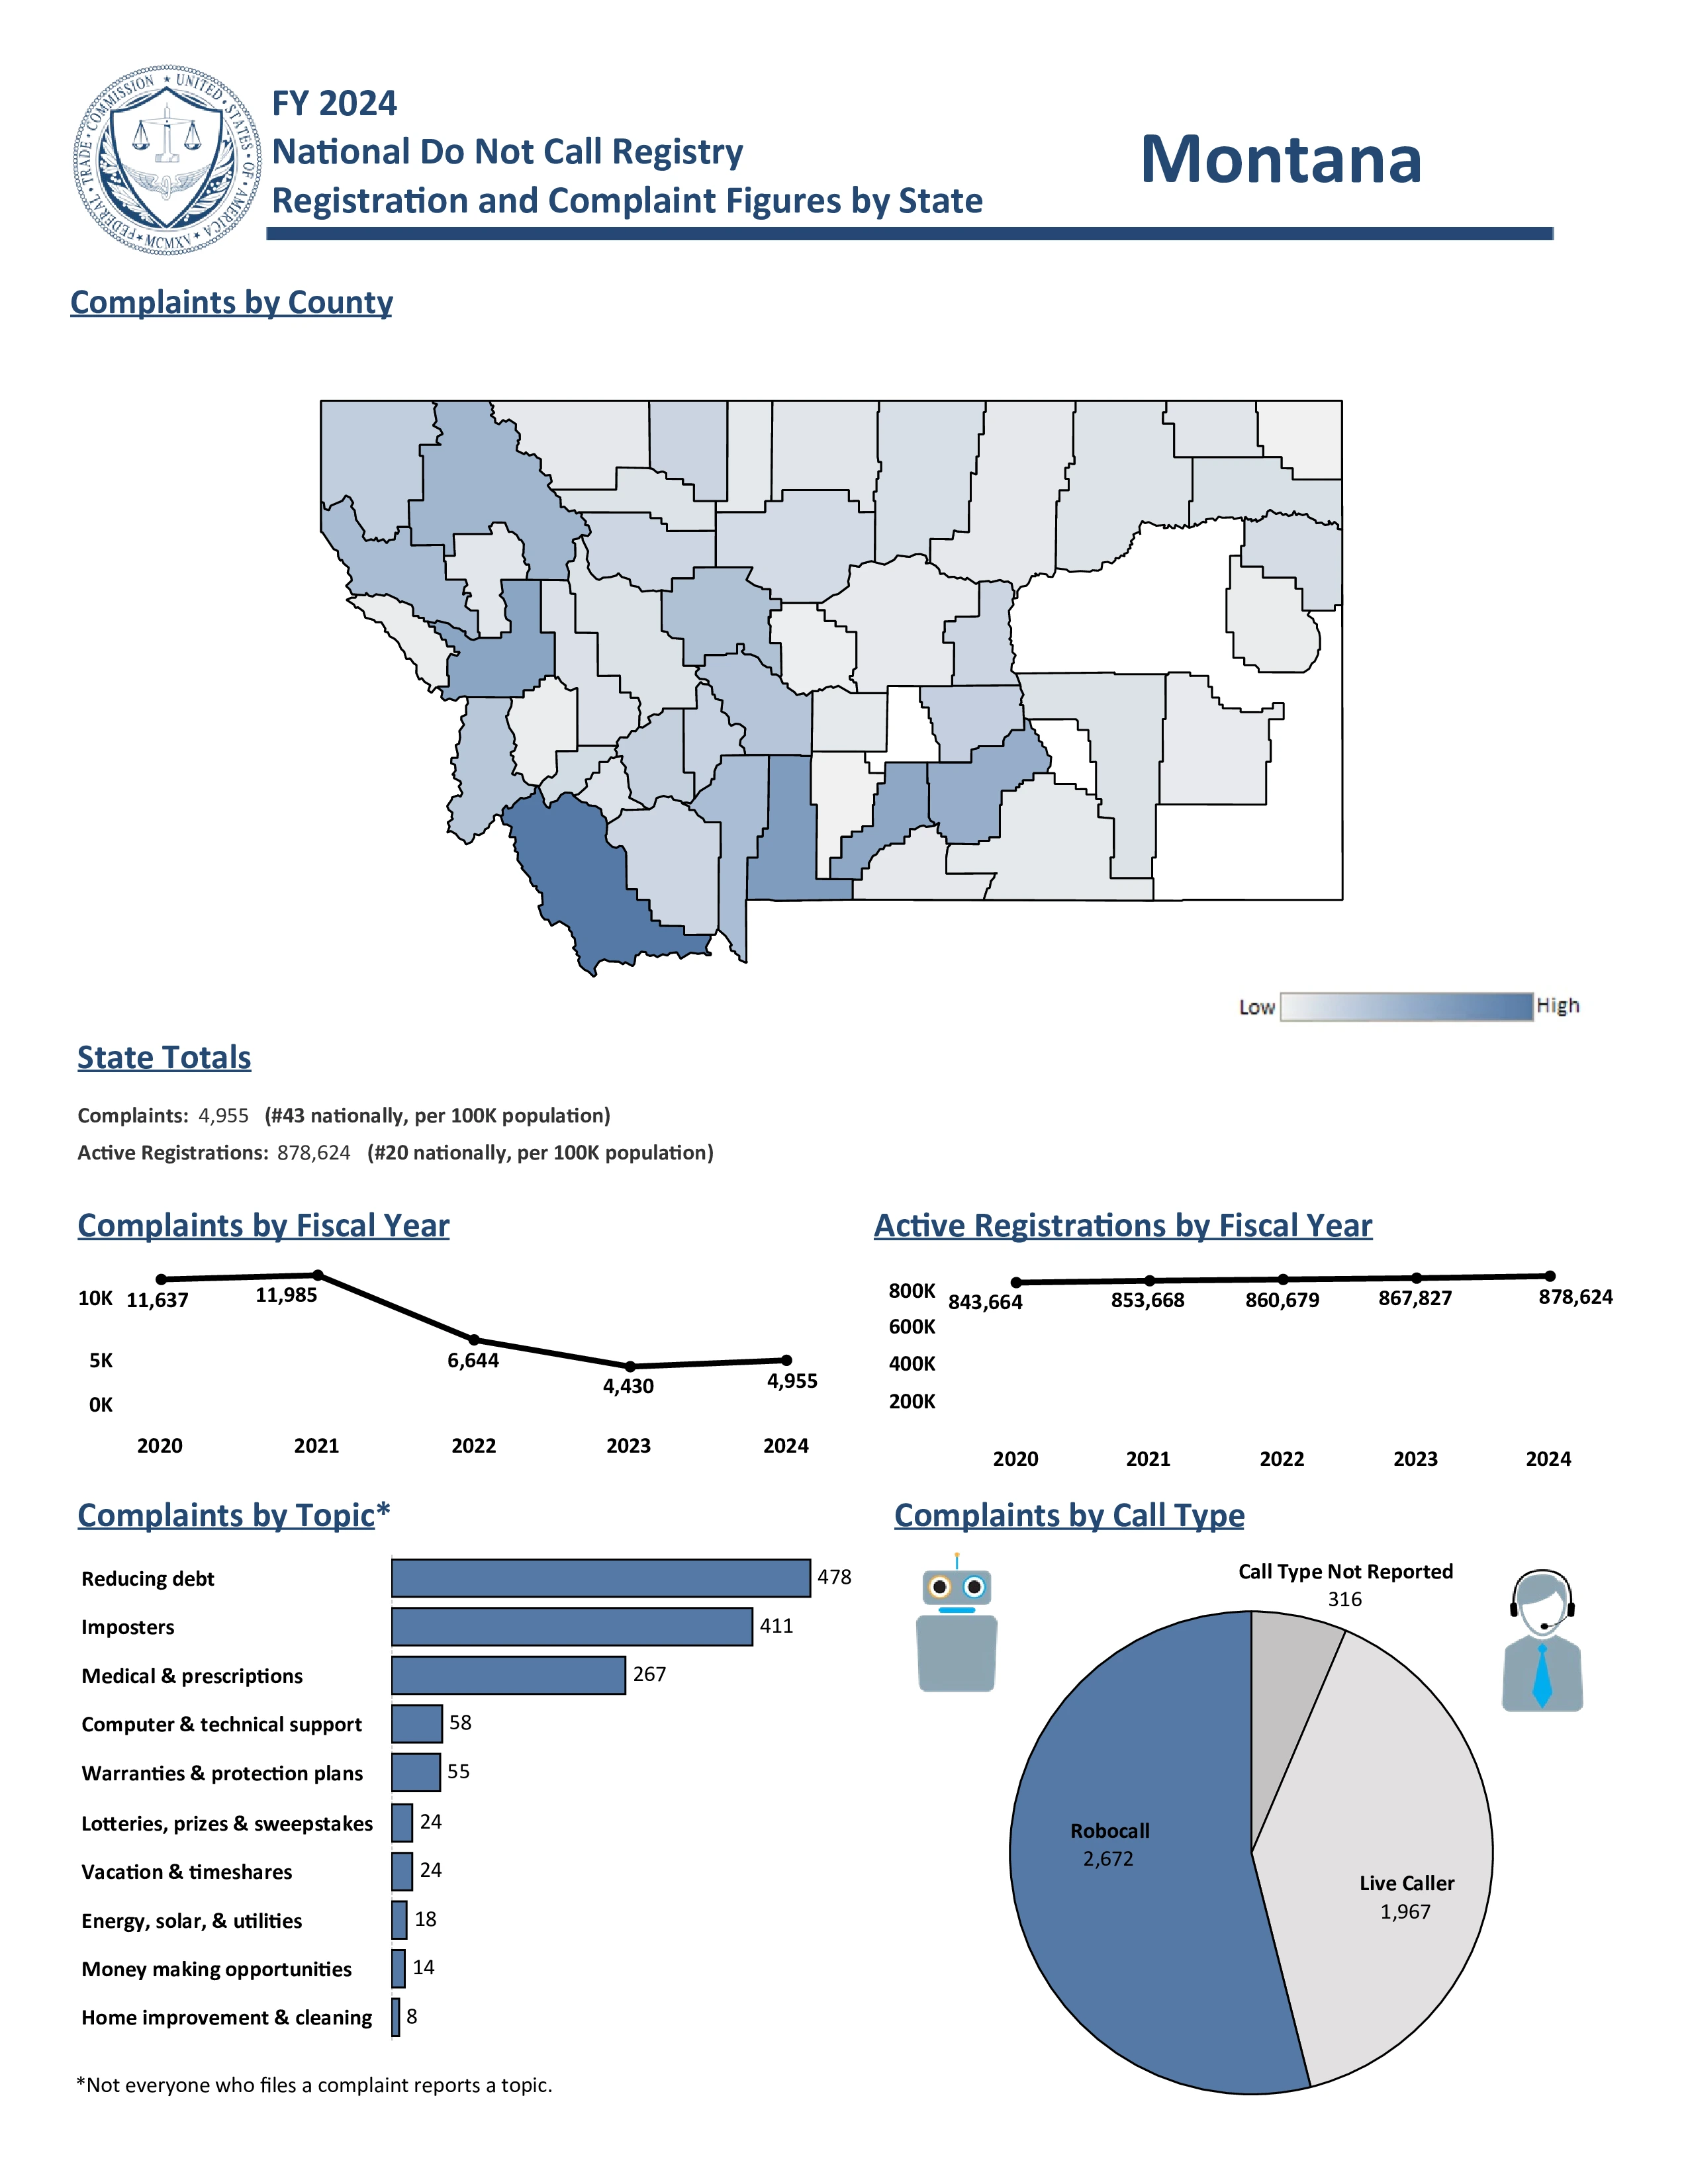
Scams and Spam Calls: The 406 area code gets U.S. Postal Service Impersonation scams and Middle-of-the-Night Harassment calls. Fake Amazon Purchase Verification is reported, along with Fake Process Server & Arrest Warrant threats and Vehicle Extended Warranty robocalls.
Important: Area codes show where a number was originally assigned, not where the caller currently lives. Federal number portability laws
allow people to keep their phone numbers when moving or switching carriers. Use our reverse phone lookup tool above to get detailed phone number owner information.
For latest Montana phone numbering regulations, contact Katie Sheard at the Montana PSC via [email protected] or 406-444-4266.
Montana Phone Numbers
Montana has approximately 1.46 million active phone numbers. Cell phones are the most popular type, with about 1.2 million users, while traditional landlines continue to decrease with about 104,000 connections statewide. Internet phone services have around 152,000 subscribers.
This means that when you search a Montana phone number, it's most likely a cell phone. The decreasing number of landlines implies newer phone numbers are often harder to trace compared to older landline numbers, which had more readily available public information.
Montana Voice Subscriptions (in thousands):
| Service Type |
June 2023 |
Dec 2023 |
June 2024 |
| Mobile telephony |
1,167 |
1,188 |
1,203 |
| Local exchange telephone service |
118 |
109 |
104 |
| VoIP subscriptions |
154 |
158 |
152 |
| Total |
1,439 |
1,455 |
1,459 |
Source: FCC Voice Telephone Services Report
Top 5 US Cell Phone Companies
Most phone numbers are cell phones, and most cell phone numbers come from the top three United States wireless companies. Here are the top five US Cell Phone Companies in Q1 2025:
- Verizon - 146 million customers
- T-Mobile US - 131 million customers
- AT&T Mobility - 118 million customers
- Boost Mobile - 7 million customers
- U.S. Cellular - 4.4 million customers


