Minnesota has 8 active area codes, and the regional differences between them make spoofed calls feel more credible. Callers using 612 Minneapolis and 651 St. Paul numbers frequently pose as United Healthcare or Medicare representatives asking you to verify your plan details, and fake process servers claiming to deliver legal documents are reported across multiple area codes. Someone asking for your healthcare details or threatening legal action? Look them up in the reverse phone lookup tool above before you say another word.
Scam and Spam Phone Number Lookup
That call from "United Healthcare" might just be a spoofer looking to harvest your credit card details. Verify the source to reveal if it’s a legitimate medical provider or a known health insurance fraud.
Phone Scams in Minnesota
Health Insurance impersonation and Fake Process Server threats are very common.
Aggressive roofing telemarketers, "Can you hear me" scams
In 2024, Minnesota residents reported 31,081 fraud cases resulting in total losses of $144,567,540, with a median loss of $412 per victim. Received a fraudulent call or lost money to a phone scam? Report fraud or scam:
In 2024, Minnesota residents filed 29,033 unwanted call complaints with the FTC, of which 16,032 were robocalls and 8,896 involved live callers. The most reported complaint topics were reducing debt (2,055), imposters (1,931), medical and prescriptions (1,363).
To reduce spam calls, register all your phone numbers at National Do Not Call Registry (donotcall.gov or call 1-888-382-1222 from the number you want to protect).
Recently Reported Spam Numbers in Minnesota
Phone numbers reported as unwanted calls to the FTC by Minnesota residents in the last 30 days.
(855) 994-2142
Reducing your debt (credit cards, mortgage, student loans)
12 reports
·
(855) 994-1953
Reducing your debt (credit cards, mortgage, student loans)
10 reports
·
(855) 909-0815
Reducing your debt (credit cards, mortgage, student loans)
10 reports
·
(877) 578-4104
Reducing your debt (credit cards, mortgage, student loans)
7 reports
·
(866) 959-1387
Reducing your debt (credit cards, mortgage, student loans)
7 reports
·
(866) 398-2896
Reducing your debt (credit cards, mortgage, student loans)
6 reports
·
(315) 215-8040
Reducing your debt (credit cards, mortgage, student loans)
6 reports
·
(833) 583-3781
Other
5 reports
·
(571) 586-5571
Other
5 reports
·
(866) 398-3898
Reducing your debt (credit cards, mortgage, student loans)
4 reports
·
Reverse Phone Lookup by Area Code
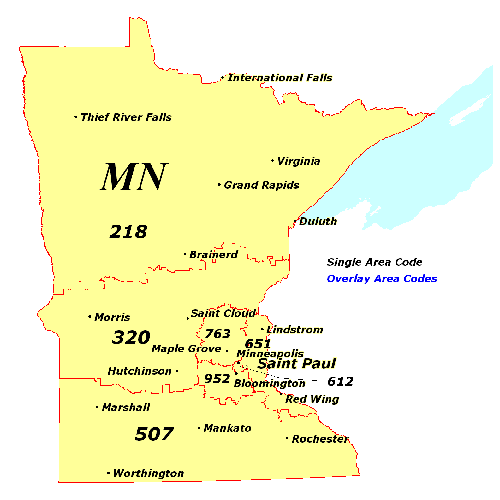
Minneapolis uses 612/763, St. Paul has 651, suburbs split across 952 and 763, northern Minnesota operates 218, and the south uses 507. The table below maps these codes to cities. For actual caller identification beyond regional codes, enter the number above to find the owner and their location.
Important: Area codes do not guarantee the caller's current location. Minnesota allows number portability, and scammers often use "neighbor spoofing" to make calls appear local.
Reverse Phone Directory Minnesota
Browse our reverse phone directory by selecting a city below:
Is It Legal to Do a Reverse Phone Lookup in Minnesota?
Yes, using reverse phone lookup services is completely legal in Minnesota when used for personal purposes like identifying unknown numbers or avoiding scam calls. That said, federal law under the Fair Credit Reporting Act (FCRA) prohibits using lookup results for hiring decisions, tenant screening, or determining credit eligibility.
FAQs
How to opt out of phone number lookup websites in Minnesota?
Under the Minnesota Consumer Data Privacy Act (MCDPA), effective July 31, 2025, you can request removal of your personal information and opt out of its sale. Visit each reverse lookup site and click "Do Not Sell My Personal Information" to submit a request.
How do I know if a Minnesota business phone number is legit?
A reverse phone lookup can provide a business name, but that alone does not confirm legitimacy. While Minnesota has over 154,314 business establishments based on Census data, you should verify the company by searching for it in the Minnesota Business Filings Search.
Do people in Minnesota mostly use mobile phones or landlines?
Minnesota has 6.4 million mobile subscriptions, 1.2 million VoIP lines, and 467,000 landlines.