Reverse Phone Number Lookup in Louisiana
A reverse phone lookup in Louisiana reveals who owns any phone number by searching open public databases from government records. Whether in New Orleans or Baton Rouge, residents can uncover the registered name and address of unknown numbers safely and legally. This phone search lookup helps identify potential scammers, verify contacts, and determine whether unknown calls are worth answering.
Reverse Phone Lookup by Louisiana Area Code
All Louisiana phone numbers consist of three parts: the three-digit Area Code,
the three-digit Prefix Code (also known as the exchange or central office code),
and the final four-digit line number. While the area code narrows down the
location to a large region, the prefix code can often specify the original city
or town where the number was registered.

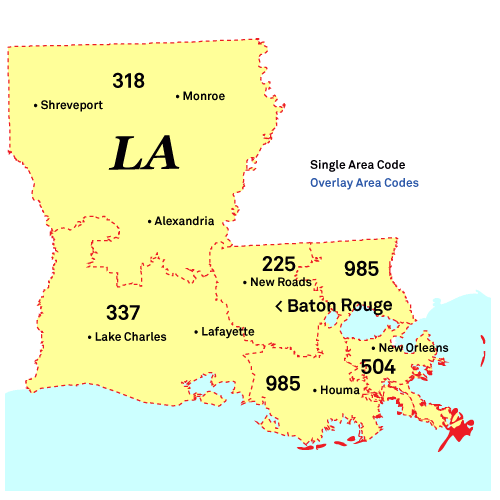
Here's a complete list of Louisiana area codes:
Area Code 225: Baton Rouge, Prairieville, Central
Location: The 225 area code covers southeastern Louisiana, including major cities like Baton Rouge, Denham Springs, and Hammond.
Common Callers: Louisiana state government offices, LSU alumni fundraising, and ExxonMobil refinery safety officers.
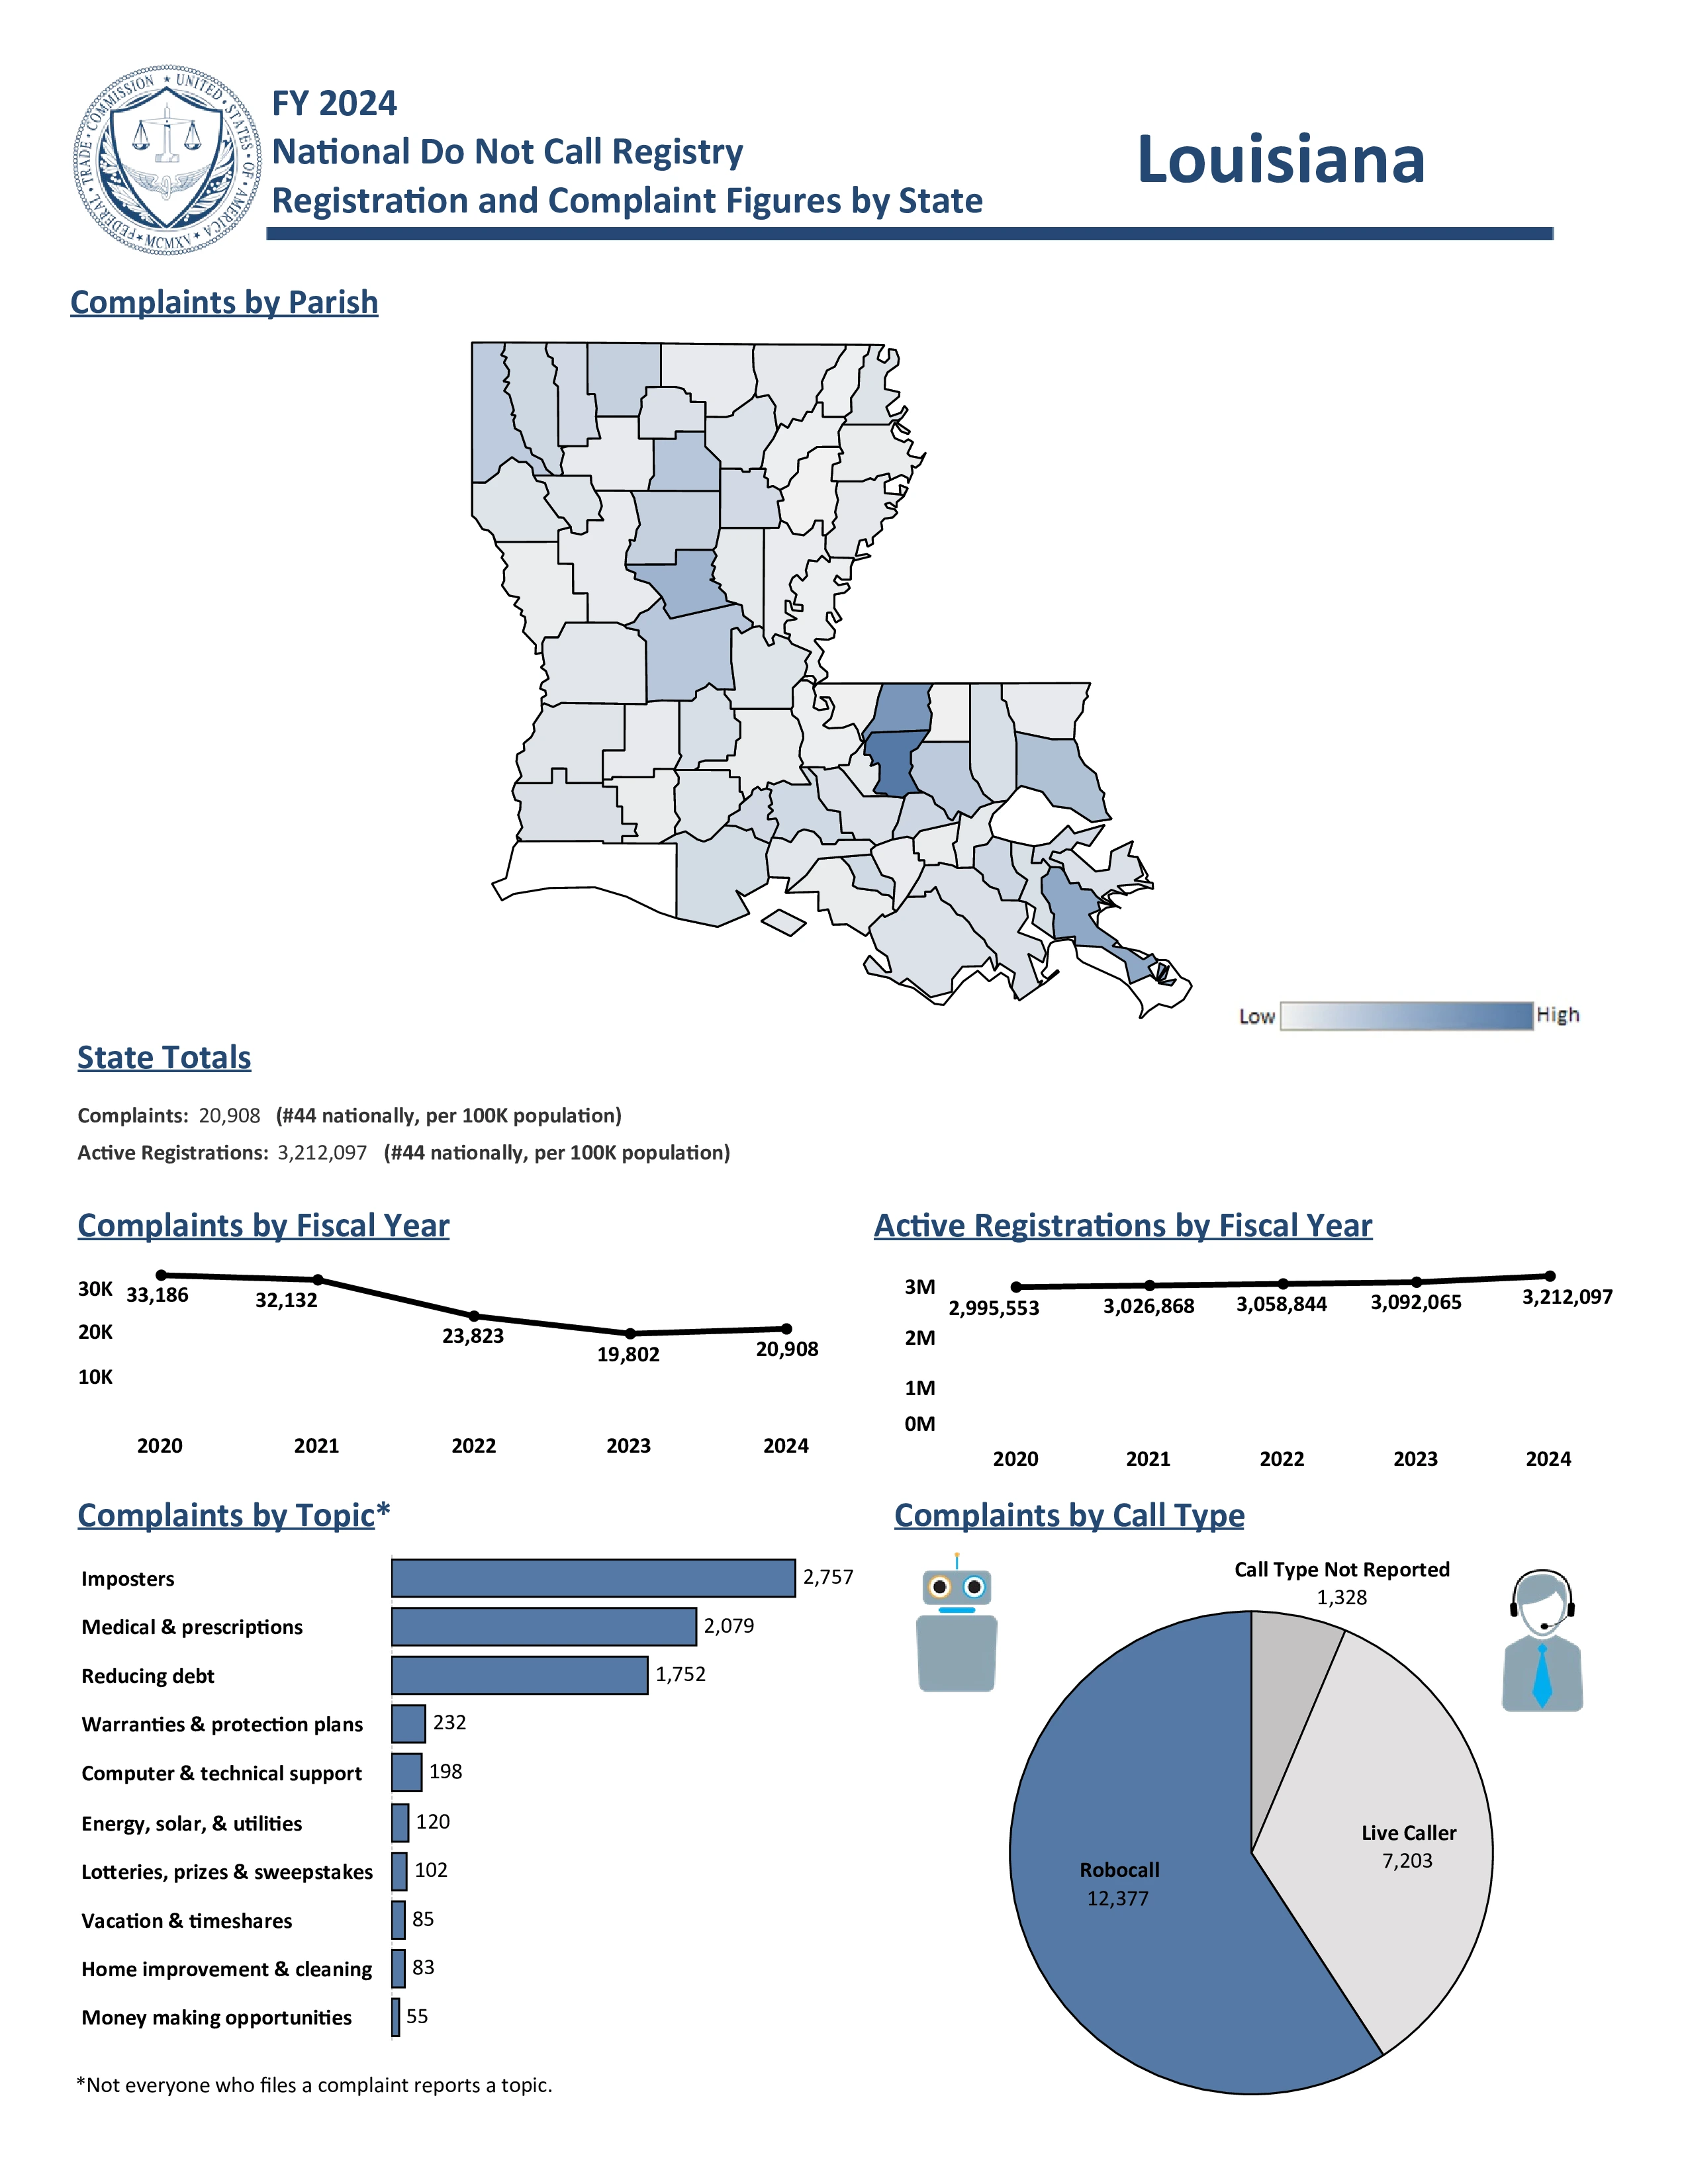
Scams and Spam Calls: The 225 area code gets Entergy Disconnection Threats and Fake Amazon & Microsoft Purchase scams. Fake Process Server & Legal threats are frequent, as are Medicare Information phishing and Extended Auto Warranty robocalls.
Area Code 318: Shreveport, Bossier City, Monroe
Location: The 318 area code covers northern and central Louisiana, including major cities like Shreveport, Monroe, and Alexandria.
Common Callers: Barksdale Air Force Base admin, Lumen Technologies support, and casino marketing hosts.
Scams and Spam Calls: The 318 area code is targeted by Fake Inmate & Jail Call scams and Publishers Clearing House (PCH) Winnings fraud. Fake Lawsuit and Process Server scams are common, along with Impersonation Charity scams and Phishing Texts.
Area Code 337: Lafayette, Lake Charles, New Iberia
Location: The 337 area code covers southwestern Louisiana, including major cities like Lafayette, Lake Charles, and New Iberia.
Common Callers: Offshore oil field service dispatchers, petrochemical refinery HR, and Fort Johnson personnel.
Scams and Spam Calls: The 337 area code reports "Bring Back Louisiana" Vaccine calls and Fake Medical Billing Department scams. Aggressive Vehicle Warranty robocalls are common, as are Fake Debt Collector threats and Amazon Purchase Confirmation scams.
Area Code 504: New Orleans, Metairie, Kenner
Location: The 504 area code covers southeastern Louisiana, including major cities like New Orleans, Metairie, and Kenner.
Common Callers: Ochsner Health appointment lines, Tulane University staff, Port of New Orleans logistics, and Entergy support.
Scams and Spam Calls: The 504 area code is dealing with Threats to Revoke Louisiana State Benefits and the Fake "Calandra 360" Subscription Invoice scam. Fake "Google Business Listing" scams are common, along with Fake Arrest Warrants and Deceptive Auto Warranty robocalls.
Area Code 985: Houma, Laplace, Slidell
Location: The 985 area code covers southeastern Louisiana, including major cities like Houma, Slidell, and Covington.
Common Callers: Offshore marine transport dispatchers, Chevron Gulf of Mexico unit, and North Oaks Health System.
Scams and Spam Calls: The 985 area code gets Aggressive "Speak to the Owner" Business calls and Medicare & Medicaid Phishing scams. Fake Process Server & Legal Complaint scams are reported, along with Government Impersonation threats and Amazon Purchase scams.
Important: Area codes show where a number was originally assigned, not where the caller currently lives. Federal number portability laws
allow people to keep their phone numbers when moving or switching carriers. Use our reverse phone lookup tool above to get detailed phone number owner information.
For latest Louisiana phone numbering regulations, contact Arnold Chauviere at the Louisiana PSC via [email protected] or 225-342-1403.
Louisiana Phone Numbers
Louisiana has approximately 6.2 million active phone numbers. Cell phones are the most popular choice with 5.2 million users, while traditional landlines are decreasing with only 216,000 connections statewide. Internet phone services account for about 728,000 numbers.
This means that when you search a Louisiana phone number, it's most likely a cell phone. The decline of landlines indicates that newer phone numbers may be harder to trace compared to older landline numbers, which often had more readily available public information.
Louisiana Voice Subscriptions (in thousands):
| Service Type |
June 2023 |
Dec 2023 |
June 2024 |
| Mobile telephony |
5,203 |
5,252 |
5,247 |
| Local exchange telephone service |
270 |
258 |
216 |
| VoIP subscriptions |
751 |
741 |
728 |
| Total |
6,224 |
6,251 |
6,191 |
Source: FCC Voice Telephone Services Report
Top 5 US Cell Phone Companies
Most phone numbers are cell phones, and most cell phone numbers come from the top three United States wireless companies. Here are the top five US Cell Phone Companies in Q1 2025:
- Verizon - 146 million customers
- T-Mobile US - 131 million customers
- AT&T Mobility - 118 million customers
- Boost Mobile - 7 million customers
- U.S. Cellular - 4.4 million customers


