Reverse Phone Lookup by Kansas Area Code
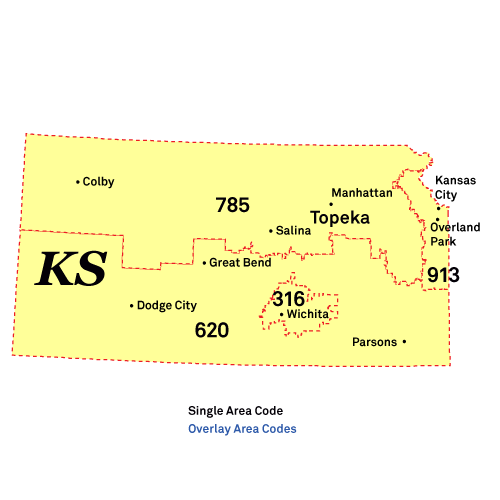
Wichita uses 316, Topeka and the north operate on 785, Kansas City metro has 913, and 620 covers southern regions. Four area codes quarter the state (check the table below for cities). To identify actual callers rather than just regions, search the number for owner details.

| Area Code |
Cities |
|
316 |
Wichita, Derby, Newton |
|
620 |
Hutchinson, Dodge City, Garden City |
|
785 |
Topeka, Lawrence, Manhattan |
|
913 |
Overland Park, Kansas City, Olathe |
Important: Area codes do not guarantee the caller's current location. Kansas allows number portability, and scammers often use "neighbor spoofing" to make calls appear local.
Kansas Spam & Scam Number Lookup
High volumes of fake Amazon and Apple security alerts are currently originating from Kansas area codes. Check the number against our fraud registry to see if it matches the statistical profile of these tech support scams.
Scams in Kansas
Aggressive debt collectors and Student Loan scams are frequently reported.
| Area Code |
Unique Reported Scams |
| 785 |
Cable upgrade scams, Delivery text scams |
| 913 |
Comenity Bank harassment, "Buy houses" calls |
In 2024, Kansas residents reported 14,747 fraud cases resulting in total losses of $57,590,798, with a median loss of $402 per victim. Received a fraudulent call or lost money to a phone scam? Report fraud or scam:
Spam Calls in Kansas
In 2024, Kansas residents filed 17,009 unwanted call complaints with the FTC, of which 8,787 were robocalls and 6,158 involved live callers. The most reported complaint topics were medical and prescriptions (2,209), imposters (980), reducing debt (913).
To reduce spam calls, register all your phone numbers at National Do Not Call Registry (donotcall.gov or call 1-888-382-1222 from the number you want to protect).
How Kansas Reverse Call Lookup Works
Kansas residents can look up the phone number of any unfamiliar caller to find out who's behind it. The service searches public government databases for available name and address details, checks FTC records for Do Not Call and robocall complaints, and pulls user-submitted scam reports. That's the information you need to judge whether a call is worth returning.
- Enter the phone number, including the area code. The KC metro uses 913, Wichita is 316, and 785 and 620 cover the rest of the state.
- We search public records, government databases, FTC complaint files, and reports from other users.
- Available owner info and any flags come back with the results. Kansas shares the Kansas City metro with Missouri, so you may see calls from both 913 and 816. The lookup works for either.
Can You Legally Do a Reverse Phone Lookup in Kansas?
Yes, Kansas residents can legally use reverse phone lookup services for personal reasons, including identifying mystery callers and detecting scams. However, using results for job screening, rental applications, or credit checks is not allowed under Fair Credit Reporting Act (FCRA) regulations.
FAQs
How do I remove my phone number from Kansas directories?
Kansas doesn't have a privacy law, but you can still ask to be deleted from phone directory sites. Look for opt-out forms on their privacy pages or contact support to request removal.
How to tell if a Kansas caller is a real business?
A phone number linked to a business name does not always mean the call is genuine. According to U.S. Census data, there are over 75,991 business establishments in Kansas. To confirm a specific company exists, search the Kansas Business Center Search, the state’s official business entity registry.
Are Kansas phone numbers usually cell phones?
Kansas has 3.2 million mobile subscriptions, 511,000 VoIP numbers, and 146,000 landlines.


