Reverse Phone Number Lookup in Kansas
A reverse phone lookup in Kansas helps you discover who owns a phone number by searching public records and government databases. This phone number search provides the registered name, address, and line type, giving Kansans the information they need to decide whether a call is worth answering. Use this number lookup to check unknown numbers before calling back.
Reverse Phone Lookup by Kansas Area Code
All Kansas phone numbers consist of three parts: the three-digit Area Code,
the three-digit Prefix Code (also known as the exchange or central office code),
and the final four-digit line number. While the area code narrows down the
location to a large region, the prefix code can often specify the original city
or town where the number was registered.

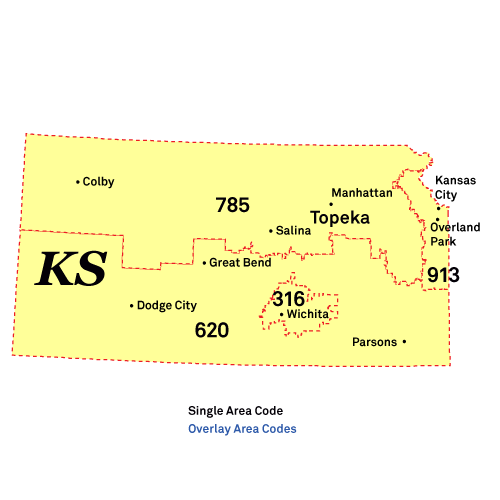
Here's a complete list of Kansas area codes:
Area Code 316: Wichita, Derby, Newton
Location: The 316 area code covers south-central Kansas, including major cities like Wichita, Andover, and Derby.
Common Callers: Spirit AeroSystems contractors, Textron Aviation (Cessna) support, and Koch Industries corporate.
Scams and Spam Calls: The 316 area code is dealing with Medicare Genetic Testing & Medical Supply scams and Fake Process Server threats. Fake Amazon Purchase alerts are frequent, as are Student Loan Forgiveness scams and Phony Social Security Administration calls.
Area Code 620: Hutchinson, Dodge City, Garden City
Location: The 620 area code covers southern and eastern Kansas, including major cities like Hutchinson, Pittsburg, and Dodge City.
Common Callers: Meat packing plant HR (National Beef/Cargill), wind turbine technicians, and Pittsburg State University staff.
Scams and Spam Calls: The 620 area code is targeted by Aggressive "Portfolio Recovery" Debt Collector scams and Fake Process Server threats. Student Loan Forgiveness scams are common, along with Subscription Auto-Renewal fraud and Social Security Suspension threats.
Area Code 785: Topeka, Lawrence, Manhattan
Location: The 785 area code covers northern and western Kansas, including major cities like Topeka, Lawrence, and Manhattan.
Common Callers: Kansas State government agencies, KU/K-State alumni associations, and Fort Riley housing officers.
Scams and Spam Calls: The 785 area code reports Publishers Clearing House "Second Prize Winner" scams and Cable Provider "Upgrade" fraud. Fake Package Delivery Text messages are frequent, as are Fake Process Server threats and "Can You Hear Me?" voice phishing.
Area Code 913: Overland Park, Kansas City, Olathe
Location: The 913 area code covers northeastern Kansas, including major cities like Kansas City, Overland Park, and Olathe.
Common Callers: Garmin customer support, T-Mobile campus recruiters, and University of Kansas Health System scheduling.
Scams and Spam Calls: The 913 area code gets Aggressive "Comenity Bank" Collection calls and the "Hello Grandma" Impersonation scam. Unsolicited "We Buy Houses" calls are reported, along with Phantom Debt threats and Fake Amazon/Apple Purchase scams.
Important: Area codes show where a number was originally assigned, not where the caller currently lives. Federal number portability laws
allow people to keep their phone numbers when moving or switching carriers. Use our reverse phone lookup tool above to get detailed phone number owner information.
For latest Kansas phone numbering regulations, contact Drennan Dolsky at the Kansas CC via [email protected] or 785-271-3142.
Kansas Phone Numbers
Kansas has approximately 3.8 million active phone numbers. Cell phones make up the majority with 3.1 million users, while traditional landlines are declining with just 146,000 connections statewide. Internet phone services account for about 511,000 numbers.
This means that when you search a Kansas phone number, it's most likely a cell phone. The shift away from landlines means newer phone numbers are typically harder to trace than older landline numbers that had more public information available.
Kansas Voice Subscriptions (in thousands):
| Service Type |
June 2023 |
Dec 2023 |
June 2024 |
| Mobile telephony |
3,081 |
3,132 |
3,165 |
| Local exchange telephone service |
180 |
167 |
146 |
| VoIP subscriptions |
546 |
521 |
511 |
| Total |
3,807 |
3,820 |
3,822 |
Source: FCC Voice Telephone Services Report
Top 5 US Cell Phone Companies
Most phone numbers are cell phones, and most cell phone numbers come from the top three United States wireless companies. Here are the top five US Cell Phone Companies in Q1 2025:
- Verizon - 146 million customers
- T-Mobile US - 131 million customers
- AT&T Mobility - 118 million customers
- Boost Mobile - 7 million customers
- U.S. Cellular - 4.4 million customers


