Reverse Phone Lookup by Illinois Area Code
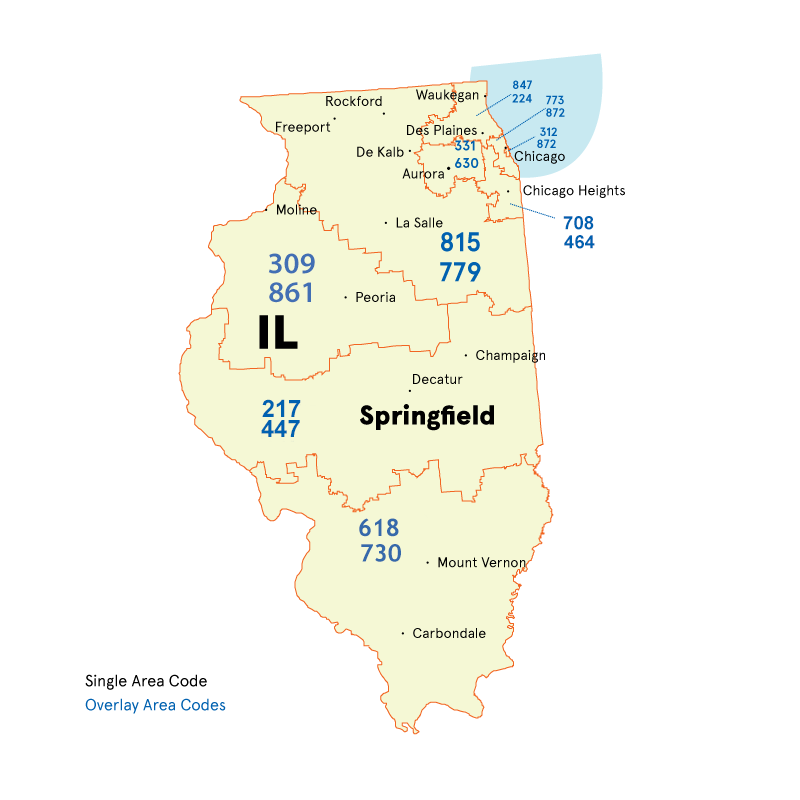
Chicago 's complex overlay system uses 312/872/464 downtown, 773 in neighborhoods, 630/331 in western suburbs, 847/224 up north. Springfield has 217, Peoria uses 309. The table below maps all Illinois codes to their cities, but area codes alone won 't protect you from spoofed calls. Search the number for the owner.

| Area Code |
Cities |
|
217 |
Springfield, Champaign, Decatur |
|
224 |
Elgin, Waukegan, Arlington Heights |
|
309 |
Peoria, Bloomington, Normal |
|
312 |
Chicago |
|
331 |
Aurora, Joliet, Naperville, Bolingbrook |
|
447 |
Springfield, Champaign, Decatur |
|
464 |
Cicero, Orland Park, Berwyn |
|
618 |
Belleville, Granite City, O'Fallon |
|
630 |
Aurora, Joliet, Naperville, Bolingbrook |
|
708 |
Cicero, Orland Park, Berwyn |
|
730 |
Belleville, Granite City, O'Fallon |
|
773 |
Chicago |
|
779 |
Rockford, Joliet, DeKalb |
|
815 |
Rockford, Joliet, DeKalb |
|
847 |
Elgin, Waukegan, Arlington Heights |
|
861 |
Peoria, Bloomington, Normal |
|
872 |
Chicago |
Important: Area codes do not guarantee the caller's current location. Illinois allows number portability, and scammers often use "neighbor spoofing" to make calls appear local.
Illinois Spam & Scam Number Lookup
That "Grubhub" delivery issue or "Chicago Police" call is often just a script read by a scammer to steal your data. Unmask the deception by looking up the number to see if it’s a known imposter tactic reported in Illinois.
Scams in Illinois
Statewide threats include SSA/Medicare scams, Student Loan forgiveness, and fake debt collection.
| Area Code |
Unique Reported Scams |
| 312 |
Grubhub delivery fraud, Suspicious CDC surveys, Wrong number texts |
| 331 |
Fake HR threats, Medical survey calls |
| 618 |
Rental overpayment scams, Abusive telemarketers |
| 815 |
Mortgage foreclosure scams, Google listing scams |
| 847 |
Fake bank debt calls, Retail support scams |
In 2024, Illinois residents reported 71,060 fraud cases resulting in total losses of $318,113,996, with a median loss of $400 per victim. Received a fraudulent call or lost money to a phone scam? Report fraud or scam:
Spam Calls in Illinois
In 2024, Illinois residents filed 102,690 unwanted call complaints with the FTC, of which 56,038 were robocalls and 33,277 involved live callers. The most reported complaint topics were medical and prescriptions (7,908), imposters (7,507), reducing debt (7,050).
To reduce spam calls, register all your phone numbers at National Do Not Call Registry (donotcall.gov or call 1-888-382-1222 from the number you want to protect).
How Illinois Number Search Works
Between the Chicago metro and downstate communities, Illinois residents field no shortage of unknown calls. A phone number search checks public government databases for owner name and address information, cross-references FTC complaint data, and includes user-submitted spam reports. That combination helps you quickly tell legitimate callers from scam operations.
- Enter the Illinois phone number, including the area code. Chicago uses 312, 773, 872, and others. Suburbs and downstate have codes like 630, 815, and 217.
- Our system searches public records, government databases, FTC complaint data, and user reports.
- Any owner details on file show up, along with spam flags. Chicago-area numbers appear in robocall complaint data more than almost any other metro.
Is It Legal to Do a Reverse Phone Lookup in Illinois?
Reverse phone lookup is legal in Illinois for everyday personal use. Whether you're checking an unknown caller, verifying a contact, or spotting potential fraud, you're within your rights. Keep in mind that the Fair Credit Reporting Act (FCRA) restricts using this information for employment, housing, or credit decisions.
FAQs
How do I remove my number from phone lookup sites in Illinois?
Illinois doesn't have a privacy law covering phone lookup sites. You can still request removal. Visit each site's privacy page, look for the opt-out or "remove my info" form, fill it out with your phone number, and complete verification.
How to confirm a Illinois business caller is real?
Getting a business name from a phone lookup is helpful, but verification is key. With over 322,349 business establishments in Illinois according to Census data, confirming the company through the Illinois Corporation & LLC Search is the safest approach.
Do people in Illinois mostly use cell phones or landlines?
Illinois has 15.1 million mobile numbers, 2.6 million VoIP subscriptions, and 552,000 landlines.


