Reverse Phone Number Lookup in Idaho
A reverse phone lookup in Idaho helps residents identify unknown callers by searching public government databases. This phone number search provides the owner's name, address, and other available details to help Idahoans screen calls and protect themselves from unwanted contact. Use this number lookup to check who called you before answering or calling back.
Reverse Phone Lookup by Idaho Area Code
All Idaho phone numbers consist of three parts: the three-digit Area Code,
the three-digit Prefix Code (also known as the exchange or central office code),
and the final four-digit line number. While the area code narrows down the
location to a large region, the prefix code can often specify the original city
or town where the number was registered.

Here's a complete list of Idaho area codes:
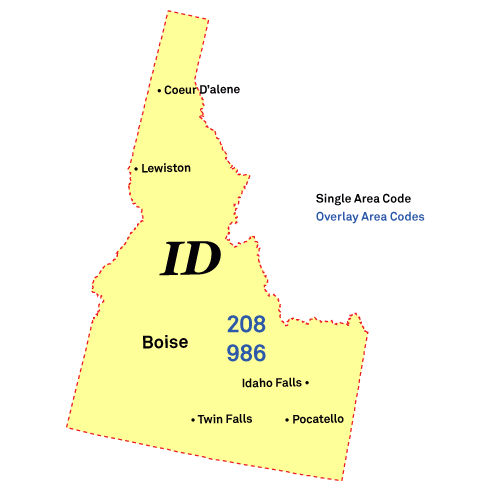
Area Codes 208/986: Nampa, Meridian
Location: The 208 and 986 area codes cover the entire state of Idaho, including major cities like Boise, Meridian, and Nampa.
Common Callers: Micron Technology headhunters, Albertsons corporate HQ, and St. Luke's Health System schedulers.
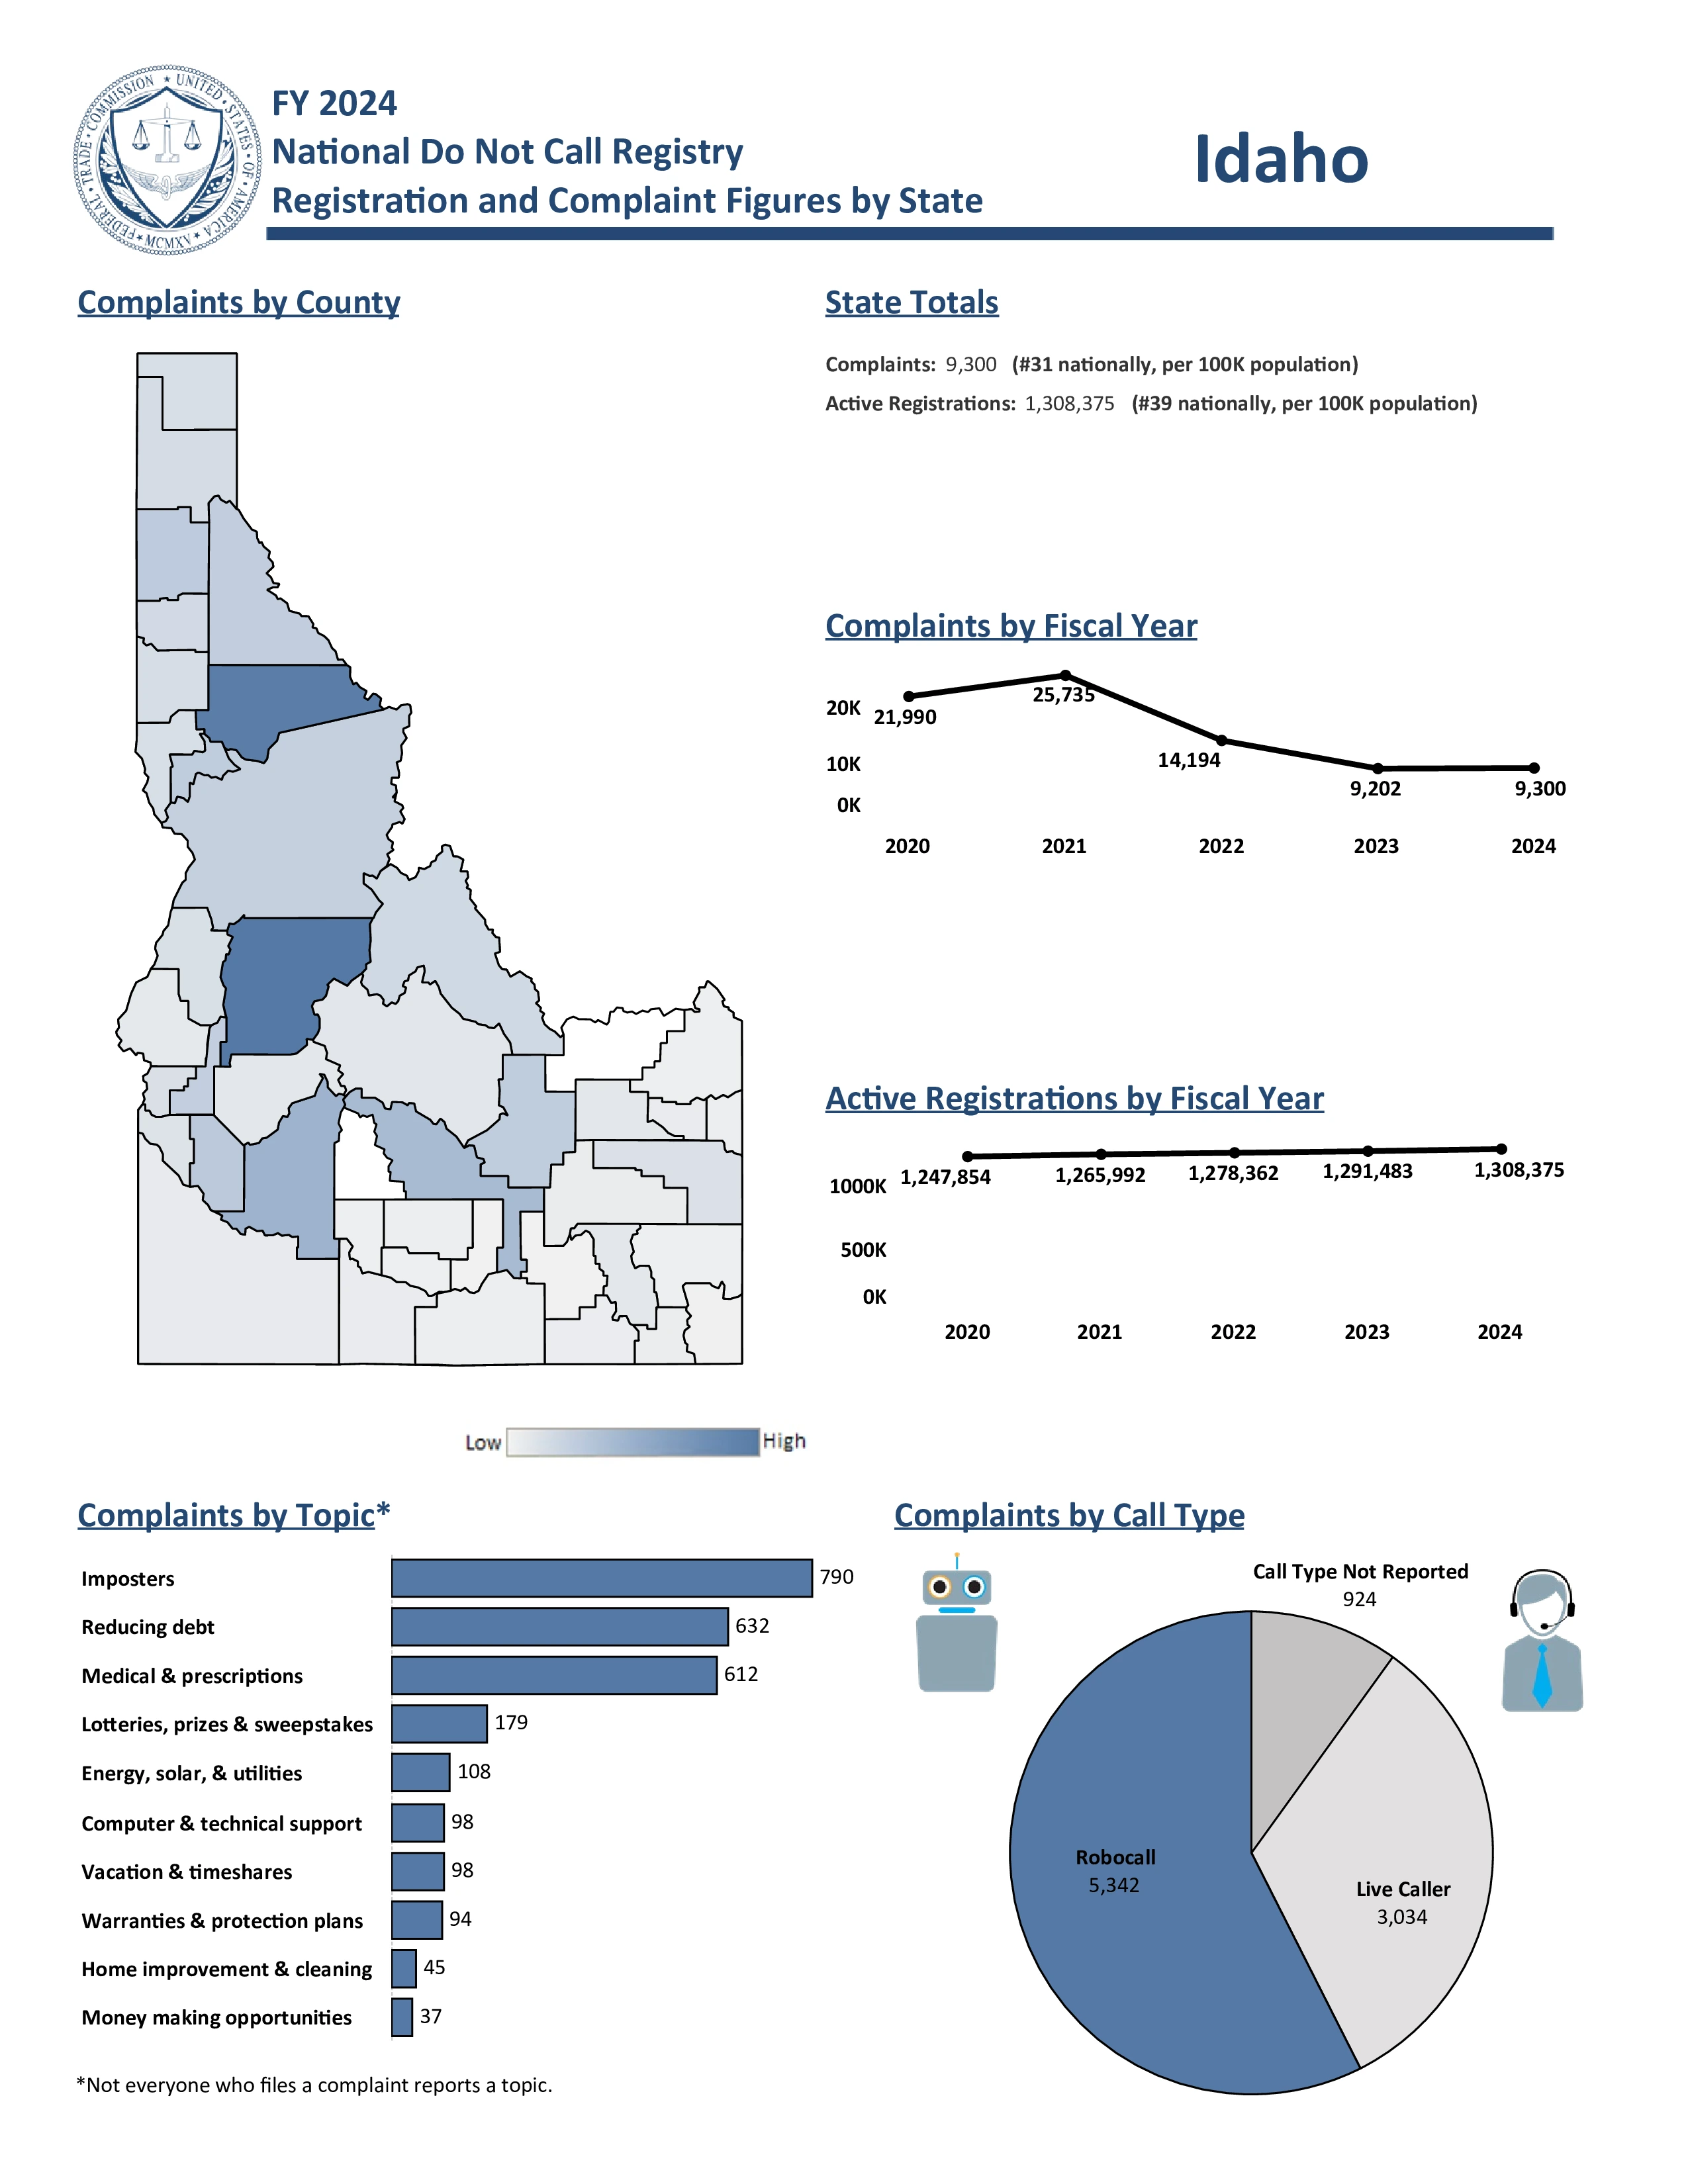
Scams and Spam Calls: The 208 and 986 area codes are targeted by specific "Apple iCloud Breach" robocalls and threats of Federal Charges or Identity Theft. While 208 reports significant Merchant Services scams targeting businesses and DOT Compliance scare tactics, 986 is dealing with high-pressure Health Insurance sales and Fake Auto Warranty expiration calls.
Important: Area codes show where a number was originally assigned, not where the caller currently lives. Federal number portability laws
allow people to keep their phone numbers when moving or switching carriers. Use our reverse phone lookup tool above to get detailed phone number owner information.
For latest Idaho phone numbering regulations, contact Johan Kalala-Kasanda at the Idaho PUC via [email protected] or 208 334-0361.
Idaho Phone Numbers
Idaho has approximately 2.3 million active phone numbers. Cell phones dominate with nearly 2 million users, while traditional landlines are declining but still present with 116,000 connections statewide. Internet phone services account for about 185,000 numbers.
This means that when you search an Idaho phone number, it's highly likely to be a cell phone. Although landlines are decreasing, a noticeable segment of the population still uses them.
Idaho Voice Subscriptions (in thousands):
| Service Type |
June 2023 |
Dec 2023 |
June 2024 |
| Mobile telephony |
1,905 |
1,975 |
1,963 |
| Local exchange telephone service |
138 |
114 |
116 |
| VoIP subscriptions |
170 |
175 |
185 |
| Total |
2,213 |
2,264 |
2,264 |
Source: FCC Voice Telephone Services Report
Top 5 US Cell Phone Companies
Most phone numbers are cell phones, and most cell phone numbers come from the top three United States wireless companies. Here are the top five US Cell Phone Companies in Q1 2025:
- Verizon - 146 million customers
- T-Mobile US - 131 million customers
- AT&T Mobility - 118 million customers
- Boost Mobile - 7 million customers
- U.S. Cellular - 4.4 million customers


