Hartwell Phone Book
Public Schools
Hotels and Motels
Libraries
Health Centers
Fire Departments
Hartwell Reverse Phone Lookup
Browse Chicago phone numbers by rate center and prefix.
Hartwell Phone Numbers
Rate Center: Hartwell (HARTWELL)
Phone numbers with the Hartwell rate center prefixes:
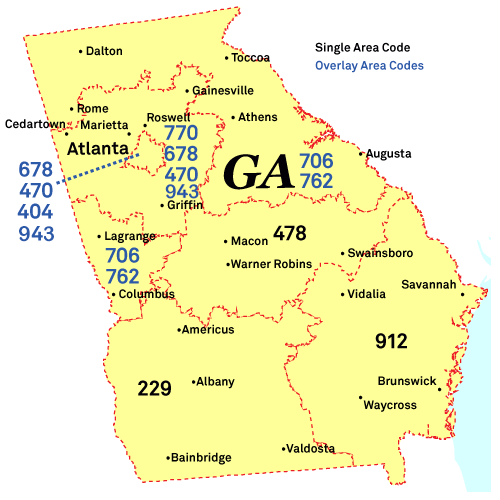
Georgia City Phone Books
- Atlanta, GA Phone Book
- Augusta, GA Phone Book
- Columbus, GA Phone Book
- Macon, GA Phone Book
- Savannah, GA Phone Book
- Athens, GA Phone Book
- Sandy Springs, GA Phone Book
- South Fulton, GA Phone Book
- Roswell, GA Phone Book
- Johns Creek, GA Phone Book
- Warner Robins, GA Phone Book
- Albany, GA Phone Book
- Alpharetta, GA Phone Book
- Marietta, GA Phone Book
- Smyrna, GA Phone Book
- Valdosta, GA Phone Book
- Brookhaven, GA Phone Book
- Stonecrest, GA Phone Book
- Dunwoody, GA Phone Book
- Peachtree Corners, GA Phone Book
- Mableton, GA Phone Book
- Gainesville, GA Phone Book
- Newnan, GA Phone Book
- Milton, GA Phone Book
- Evans, GA Phone Book
- Rome, GA Phone Book
- Tucker, GA Phone Book
- Peachtree City, GA Phone Book
- East Point, GA Phone Book
- Martinez, GA Phone Book
- Redan, GA Phone Book
- Kennesaw, GA Phone Book
- Dalton, GA Phone Book
- Hinesville, GA Phone Book
- Douglasville, GA Phone Book
- Woodstock, GA Phone Book
- Statesboro, GA Phone Book
- LaGrange, GA Phone Book
- Lawrenceville, GA Phone Book
- Chamblee, GA Phone Book
- Duluth, GA Phone Book
- Canton, GA Phone Book
- Stockbridge, GA Phone Book
- Carrollton, GA Phone Book
- McDonough, GA Phone Book
Local Time in Hartwell, GA
Local Time
07:26 PM
Date
Tuesday, July 01, 2025
Time Zone
EDT
Hartwell, GA Population
Hartwell has a population of 4382 people. Sex ratio is 88.30 males per 100 females.
Population by Age
The median age in Hartwell is 34.8 years.
| Age Groups | Population |
|---|---|
| Under 5 years | 105 |
| 5 to 9 years | 405 |
| 10 to 14 years | 287 |
| 15 to 19 years | 178 |
| 20 to 24 years | 333 |
| 25 to 29 years | 403 |
| 30 to 34 years | 259 |
| 35 to 39 years | 266 |
| 40 to 44 years | 232 |
| 45 to 49 years | 116 |
| 50 to 54 years | 340 |
| 55 to 59 years | 250 |
| 60 to 64 years | 336 |
| 65 to 69 years | 283 |
| 70 to 74 years | 176 |
| 75 to 79 years | 135 |
| 80 to 84 years | 134 |
| 85 years and over | 144 |
Race & Ethnicity
| Racial/Ethnic Groups | Percent |
|---|---|
| White | 2612 |
| Black or African American | 1529 |
| American Indian and Alaska Native | 8 |
| Native Hawaiian and Other Pacific Islander | 0 |
| Some Other Race | 49 |
| Two or more races | 204 |