Browse the Centennial phone book to find residents and businesses throughout Arapahoe County. If you received a call from an unrecognized number with area code 303 or 720, use our lookup tool to see who it belongs to before you call back.
Got a phone call or message from a Centennial phone number you don't recognize? Before you answer, call back, or reply, use our phone number lookup service to find out who called you.
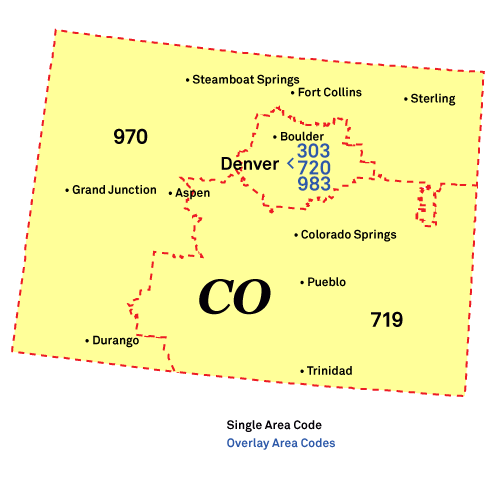
Look up by Area Code
Colorado phone numbers use area codes
303, and 720.
Select a code below to look up numbers starting with it.
According to the National Do Not Call Registry, Colorado residents filed 41,173 complaints about unwanted calls in 2024:
41,173
Unwanted Call Complaints
21,841
Robocall complaints
15,876
Live caller complaints
Phone numbers reported to the FTC as unwanted calls by Centennial residents in the last 30 days.
+1 (877) 578-4104
Reducing your debt (credit cards, mortgage, student loans)
8 reports
·
+1 (866) 398-3898
Reducing your debt (credit cards, mortgage, student loans)
4 reports
·
+1 (866) 386-5598
Reducing your debt (credit cards, mortgage, student loans)
3 reports
·
+1 (855) 994-1953
Reducing your debt (credit cards, mortgage, student loans)
2 reports
·
+1 (855) 524-7850
Reducing your debt (credit cards, mortgage, student loans)
2 reports
·
+1 (270) 870-1194
Reducing your debt (credit cards, mortgage, student loans)
1 report
·
+1 (838) 529-9709
Reducing your debt (credit cards, mortgage, student loans)
1 report
·
+1 (350) 205-9530
Reducing your debt (credit cards, mortgage, student loans)
1 report
·
+1 (719) 212-8359
Reducing your debt (credit cards, mortgage, student loans)
1 report
·
+1 (970) 499-8939
Dropped call or no message
1 report
·
Verify local business phone number
Received a call from a business but aren't sure it's really them?
Arapahoe County, according to U.S. Census Bureau data, includes 17,416 firms and 20,149 establishments employing 307,086 people.
County
Percent of City
Firms
Establishments
Arapahoe
100.00%
17416
20149
Use our reverse lookup service to verify whether a number belongs to a legitimate local business, not scammers spoofing local numbers to gain your trust.
How to Report Phone Fraud in Centennial?
If you receive fraudulent calls or suspect a scam attempt, report it to reportfraud.ftc.gov .
Arapahoe People Search
Centennial has a population of 108418 people (median age of 41.30) - thousands of potential callers you might not recognize: neighbors, an old contact, or someone you actually want to talk to. Use our local white pages to find residents' phone numbers and addresses sourced from Arapahoe County, Colorado state, and other public records.