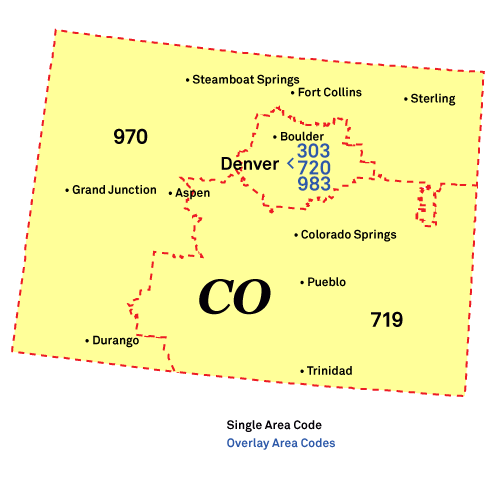
Idaho Springs Phone Book

Reverse Phone Lookup

Jump to: Phone Book Reverse Lookup Area Code Map Population

Public Schools

Carlson Elementary School

1300 Miner Street, Idaho Springs, CO 80452

Hotels and Motels

Van Eden Ranch And Retreat

3001 Van Eden Rd, Idaho Springs, CO 80452-1169

6 And 40 Motel

2920 Colorado Blvd, Idaho Springs, CO 80452

Libraries

Idaho Springs Library

219 14Th Avenue, Idaho Springs, CO 80452-5009

Museums

Clear Creek Historic Mining And Milling Museum

Po Box 1498, Idaho Springs, CO 80452

Historical Society Of Idaho Springs

Po Box 1318 2060 Miner Street, Idaho Springs, CO 80452

Alternative Fuel Stations

Kum & Go - Tesla Supercharger

1319 Miner Street, Idaho Springs, CO 80452

Beau Jos Station 1

121 15Th Ave, Idaho Springs, CO 80452

Clear Creek County Clinic

1969 Miner Street, Idaho Springs, CO 80452

Western Convenience Store

2630 Colorado Blvd, Idaho Springs, CO 80452

Local Education Agencies

Clear Creek School District No. Re-1

320 Highway 103, Idaho Springs, CO 80452

Mt Evans Boces Au

320 Highway 103, Idaho Springs, CO 80452

Idaho Springs Reverse Phone Lookup

Browse Chicago phone numbers by rate center and prefix.

Idaho Springs Phone Numbers

Rate Center: Denver (DENVER)

Phone numbers with the Denver rate center prefixes:

Idaho Springs Area Code

Idaho Springs, CO area codes are 303, 720.

Illinois Area Codes Map

Chicago, Illinois Area Code Map

Illinois City Phone Books

Local Time in Idaho Springs, CO

Local Time
04:51 PM

Date
Thursday, March 28, 2024

Time Zone
MDT

Idaho Springs, CO Population

Chicago has a population of 1848 people. Sex ratio is 94.10 males per 100 females.

Population by Age

The median age in Chicago is 34.8 years.

Age Groups Population
Under 5 years 88
5 to 9 years 50
10 to 14 years 15
15 to 19 years 134
20 to 24 years 140
25 to 29 years 187
30 to 34 years 159
35 to 39 years 38
40 to 44 years 70
45 to 49 years 159
50 to 54 years 148
55 to 59 years 190
60 to 64 years 141
65 to 69 years 143
70 to 74 years 123
75 to 79 years 55
80 to 84 years 0
85 years and over 8

Race & Ethnicity

Racial/Ethnic Groups Percent
White 1569
Black or African American 22
American Indian and Alaska Native 15
Native Hawaiian and Other Pacific Islander 2
Some Other Race 48
Two or more races 108