California Phone Numbers Reported to the FTC
California phone numbers recently reported (last 30 days) for making unwanted sales calls or robocalls:
| Phone Number | FTC Complaints | Last Reported |
|---|---|---|
| (714) 656-2386 | ||
| (818) 212-9106 | ||
| (279) 322-9780 | ||
| (442) 210-1850 | ||
| (628) 261-7841 | ||
| (747) 329-1754 | ||
| (559) 712-8608 | ||
| (279) 322-9780 | ||
| (949) 868-3495 | ||
| (559) 648-8489 |
In June 2026, California residents filed 20,737 complaints to the FTC about phone numbers making unwanted calls and text messages, down 10% from the previous month.
Common Phone Scams in California
- Chinese Consulate Mandarin Robocalls: Relentless robocalls in Mandarin spoofing the Chinese Consulate in LA/SF or DHL, claiming visas are expiring or packages are undeliverable to extort the Chinese-American community.
- LADWP, PG&E, & SMUD Disconnection: Fake utility calls claiming a technician is en route to shut off power in 15-30 minutes, demanding payments like a $499 'smart meter security deposit' via Zelle.
- Blue Shield Child Info Phishing: Automated calls claiming to be Blue Shield with 'pertinent information' about a minor child (often knowing the child's name), attempting to extract the child's birthdate.
- Crypto Investment Texts: Unsolicited texts from 'Nick Nave' or 'Rafael Cox' promoting apps like 'CoinCircle', promising 8% APY or $200 daily returns on Bitcoin or Ethereum.
- The FaceTime Flasher: Disturbing late-night harassment (midnight to 4 AM) where unknown callers initiate FaceTime video calls and engage in indecent exposure.
- Real Estate Spam ('Alice' & 'Simply Sell'): Relentless texting campaigns from 'Alice' or 'Simply Sell' targeting 916 and 209 area code homeowners for lowball cash property sales.
California Department of Consumer Affairs: File a regional report directly with state authorities by calling (800) 952-5210.
California Phone Number Lookup by Area Code
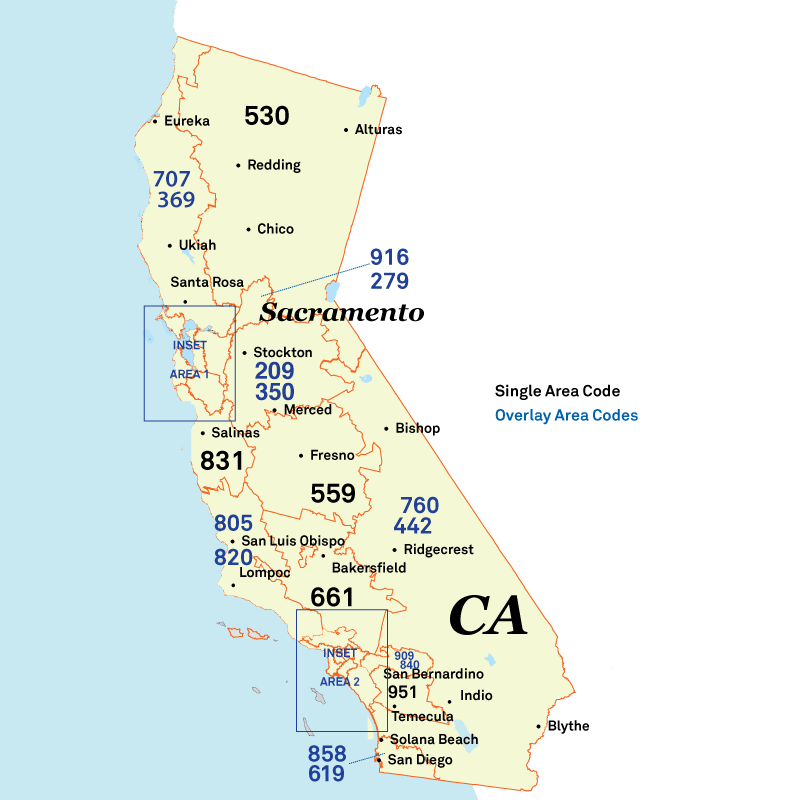
Top cities covered by each CA area code to help you start your reverse phone number search:
| Area Codes | Cities |
|---|---|
| 209/350 | Stockton, Modesto, Tracy |
| 213/323/738 | Los Angeles, East Los Angeles, South Gate |
| 279/916 | Sacramento, Elk Grove, Roseville |
| 310/424 | Los Angeles, Torrance, Compton |
| 341/510 | Oakland, Fremont, Hayward |
| 357/559 | Fresno, Visalia, Clovis |
| 369/707 | Santa Rosa, Vallejo, Fairfield |
| 408/669 | San Jose, Sunnyvale, Santa Clara |
| 415/628 | San Francisco, San Rafael, Novato |
| 442/760 | Oceanside, Escondido, Victorville |
| 530/837 | Redding, Chico, Davis |
| 562 | Long Beach, Downey, Norwalk |
| 619/858 | San Diego, Chula Vista, El Cajon |
| 626 | Pasadena, El Monte, West Covina |
| 650 | San Mateo, Daly City, Redwood City |
| 657/714 | Anaheim, Santa Ana, Huntington Beach |
| 661 | Bakersfield, Santa Clarita, Lancaster |
| 747/818 | Los Angeles, Glendale, Burbank |
| 805/820 | Oxnard, Simi Valley, Thousand Oaks |
| 831 | Salinas, Santa Cruz, Watsonville |
| 840/909 | San Bernardino, Fontana, Rancho Cucamonga |
| 925 | Concord, Antioch, Livermore |
| 949 | Irvine, Mission Viejo, Newport Beach |
| 951 | Riverside, Moreno Valley, Corona |
Phone Number Statistics: Cell Phones vs Landlines
California has approximately 57.9 million active phone numbers. Cell phones are the dominant service with 48.7 million users, while traditional landlines are declining with 1.6 million connections statewide. Internet phone services account for about 7.5 million numbers.
| Voice Subscriptions (thousands) | June 2023 | Dec 2023 | June 2024 |
|---|---|---|---|
| Mobile telephony | 47,209 | 48,351 | 48,696 |
| Local exchange telephone service | 2,274 | 2,115 | 1,646 |
| VoIP subscriptions | 7,864 | 7,521 | 7,549 |
| Total | 57,347 | 57,987 | 57,891 |
Is Reverse Phone Lookup Legal in California?
Yes. California law does not prohibit residents from using reverse phone lookup services for personal use - but California has by far the most comprehensive privacy framework in the US, giving residents tools that simply don't exist in most other states. The Fair Credit Reporting Act (FCRA) prohibits using lookup results for employment screening, tenant decisions, or credit and insurance underwriting in every state. California's state law supplements these federal rules; it does not replace them.
What California's Privacy Laws Mean for Lookup Services
California operates under the California Consumer Privacy Act / California Privacy Rights Act (CCPA/CPRA), in effect since January 1, 2020, with major CPRA amendments from January 1, 2023. What sets California apart is the 2023 Delete Act (SB 362), which directed the California Privacy Protection Agency (CPPA) to build a centralized Delete Request and Opt-Out Platform (DROP). The DROP became available to consumers on January 1, 2026, and data brokers are required to begin processing DROP deletion requests starting August 1, 2026 (Cal. Civ. Code §§ 7610–7616). That means Californians can submit a single request to remove their phone number and personal data from every registered data broker at once - a capability no other state currently offers.
Beyond the DROP, CCPA/CPRA gives California residents the right to opt out of the sale or sharing of personal information (§ 1798.120), access and correct data held about them, request deletion, and receive a portable copy. The 45-day response window applies. Unlike most state laws, CCPA/CPRA covers employees and B2B contacts in addition to consumers, and there is no blanket small-business exemption. Enforcement sits with the dedicated CPPA, not just the Attorney General.