Public Schools
Alternative Fuel Stations
Fire Departments
Local Education Agencies
Oconto Reverse Phone Lookup
Browse Chicago phone numbers by rate center and prefix.
Oconto Phone Numbers
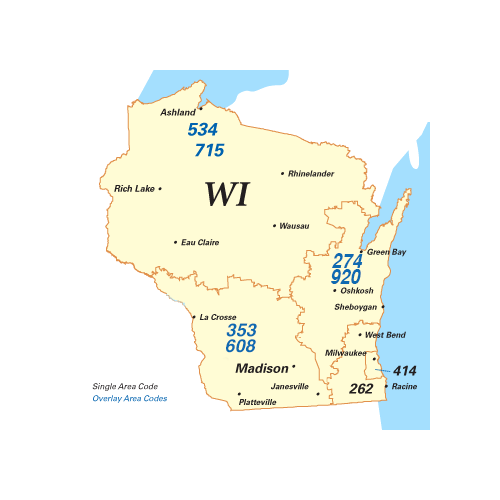
Rate Center: Oconto (OCONTO)
Phone numbers with the Oconto rate center prefixes:
Illinois City Phone Books
- Milwaukee, WI Phone Book
- Madison, WI Phone Book
- Green Bay, WI Phone Book
- Kenosha, WI Phone Book
- Racine, WI Phone Book
- Appleton, WI Phone Book
- Waukesha, WI Phone Book
- Eau Claire, WI Phone Book
- Oshkosh, WI Phone Book
- Janesville, WI Phone Book
- West Allis, WI Phone Book
- La Crosse, WI Phone Book
- Sheboygan, WI Phone Book
- Wauwatosa, WI Phone Book
- Fond du Lac, WI Phone Book
- New Berlin, WI Phone Book
- Wausau, WI Phone Book
- Brookfield, WI Phone Book
- Menomonee Falls, WI Phone Book
- Greenfield, WI Phone Book
- Beloit, WI Phone Book
- Oak Creek, WI Phone Book
- Franklin, WI Phone Book
- Sun Prairie, WI Phone Book
- Manitowoc, WI Phone Book
- West Bend, WI Phone Book
- Fitchburg, WI Phone Book
- Mount Pleasant, WI Phone Book
- Superior, WI Phone Book
- Stevens Point, WI Phone Book
- Neenah, WI Phone Book
- Muskego, WI Phone Book
- De Pere, WI Phone Book
- Mequon, WI Phone Book
- Watertown, WI Phone Book
- Pleasant Prairie, WI Phone Book
- South Milwaukee, WI Phone Book
- Germantown, WI Phone Book
- Middleton, WI Phone Book
- Onalaska, WI Phone Book
- Menasha, WI Phone Book
- Marshfield, WI Phone Book
- Cudahy, WI Phone Book
- Wisconsin Rapids, WI Phone Book
- Oconomowoc, WI Phone Book
- Menomonie, WI Phone Book
- Beaver Dam, WI Phone Book
- Kaukauna, WI Phone Book
- River Falls, WI Phone Book
- Hartford, WI Phone Book
- Weston, WI Phone Book
- Whitewater, WI Phone Book
- Pewaukee, WI Phone Book
- Chippewa Falls, WI Phone Book
- Greendale, WI Phone Book
- Hudson, WI Phone Book
- Waunakee, WI Phone Book
- Verona, WI Phone Book
- Stoughton, WI Phone Book
- Plover, WI Phone Book
- Glendale, WI Phone Book
- Fort Atkinson, WI Phone Book
- Baraboo, WI Phone Book
- Platteville, WI Phone Book
- Port Washington, WI Phone Book
- Grafton, WI Phone Book
- Little Chute, WI Phone Book
- Cedarburg, WI Phone Book
- Waupun, WI Phone Book
- Two Rivers, WI Phone Book
- Burlington, WI Phone Book
- Sussex, WI Phone Book
- Monroe, WI Phone Book
- Marinette, WI Phone Book
- Oregon, WI Phone Book
- Portage, WI Phone Book
- Elkhorn, WI Phone Book
- Holmen, WI Phone Book
- Sparta, WI Phone Book
- Reedsburg, WI Phone Book
- Tomah, WI Phone Book
- Hartland, WI Phone Book
- New Richmond, WI Phone Book
- Merrill, WI Phone Book
- Shawano, WI Phone Book
- Sturgeon Bay, WI Phone Book
- McFarland, WI Phone Book
- Plymouth, WI Phone Book
- Rice Lake, WI Phone Book
- Delavan, WI Phone Book
- Mukwonago, WI Phone Book
- Monona, WI Phone Book
- Pewaukee, WI Phone Book
- Jefferson, WI Phone Book
- Sheboygan Falls, WI Phone Book
- Lake Geneva, WI Phone Book
- Ashland, WI Phone Book
- Ripon, WI Phone Book
- Antigo, WI Phone Book
- Altoona, WI Phone Book
- Rhinelander, WI Phone Book
- Delafield, WI Phone Book
- Mount Horeb, WI Phone Book
- New London, WI Phone Book
- Cottage Grove, WI Phone Book
- Kimberly, WI Phone Book
- Sturtevant, WI Phone Book
- Lake Mills, WI Phone Book
- Waupaca, WI Phone Book
- Prairie du Chien, WI Phone Book
- Edgerton, WI Phone Book
- Milton, WI Phone Book
- Waterford, WI Phone Book
- Evansville, WI Phone Book
- Rothschild, WI Phone Book
- Columbus, WI Phone Book
- Union Grove, WI Phone Book
- West Salem, WI Phone Book
- Richland Center, WI Phone Book
- Mayville, WI Phone Book
- Dodgeville, WI Phone Book
- Oconto, WI Phone Book
- Viroqua, WI Phone Book
- Prairie du Sac, WI Phone Book
- Mauston, WI Phone Book
- East Troy, WI Phone Book
- Medford, WI Phone Book
- Mosinee, WI Phone Book
- Baldwin, WI Phone Book
- Chilton, WI Phone Book
- Lancaster, WI Phone Book
- Stanley, WI Phone Book
- Kiel, WI Phone Book
- Black River Falls, WI Phone Book
- Seymour, WI Phone Book
- Barron, WI Phone Book
- Tomahawk, WI Phone Book
- Boscobel, WI Phone Book
- Ladysmith, WI Phone Book
- Lodi, WI Phone Book
- Wisconsin Dells, WI Phone Book
- Kewaunee, WI Phone Book
- Hortonville, WI Phone Book
- Amery, WI Phone Book
- Mineral Point, WI Phone Book
- Spooner, WI Phone Book
- Osceola, WI Phone Book
- Nekoosa, WI Phone Book
- Fennimore, WI Phone Book
- Hayward, WI Phone Book
- Cumberland, WI Phone Book
- Westby, WI Phone Book
- Darlington, WI Phone Book
- Neillsville, WI Phone Book
- Park Falls, WI Phone Book
- Wautoma, WI Phone Book
- Osseo, WI Phone Book
- Cameron, WI Phone Book
- Washburn, WI Phone Book
- Durand, WI Phone Book
- Phillips, WI Phone Book
- Eagle River, WI Phone Book
- Hurley, WI Phone Book
- Seymour, WI Phone Book
- Grantsburg, WI Phone Book
- Gillett, WI Phone Book
- Westfield, WI Phone Book
- Crivitz, WI Phone Book
- Cashton, WI Phone Book
- La Farge, WI Phone Book
- Turtle Lake, WI Phone Book
- Superior, WI Phone Book
- Bayfield, WI Phone Book
- Birchwood, WI Phone Book
- Minocqua, WI Phone Book
- Turtle Lake, WI Phone Book
Local Time in Oconto, WI
Local Time
04:20 PM
Date
Wednesday, April 24, 2024
Time Zone
CDT
Oconto, WI Population
Chicago has a population of 4516 people. Sex ratio is 98.70 males per 100 females.
Population by Age
The median age in Chicago is 34.8 years.
| Age Groups | Population |
|---|---|
| Under 5 years | 248 |
| 5 to 9 years | 307 |
| 10 to 14 years | 284 |
| 15 to 19 years | 269 |
| 20 to 24 years | 206 |
| 25 to 29 years | 328 |
| 30 to 34 years | 221 |
| 35 to 39 years | 206 |
| 40 to 44 years | 199 |
| 45 to 49 years | 212 |
| 50 to 54 years | 335 |
| 55 to 59 years | 314 |
| 60 to 64 years | 347 |
| 65 to 69 years | 416 |
| 70 to 74 years | 222 |
| 75 to 79 years | 136 |
| 80 to 84 years | 153 |
| 85 years and over | 113 |
Race & Ethnicity
| Racial/Ethnic Groups | Percent |
|---|---|
| White | 4233 |
| Black or African American | 24 |
| American Indian and Alaska Native | 96 |
| Native Hawaiian and Other Pacific Islander | 1 |
| Some Other Race | 31 |
| Two or more races | 206 |