Eaton Phone Book
Public Schools
Libraries
Fire Departments
Local Education Agencies
Eaton Reverse Phone Lookup
Browse Chicago phone numbers by rate center and prefix.
Eaton Phone Numbers
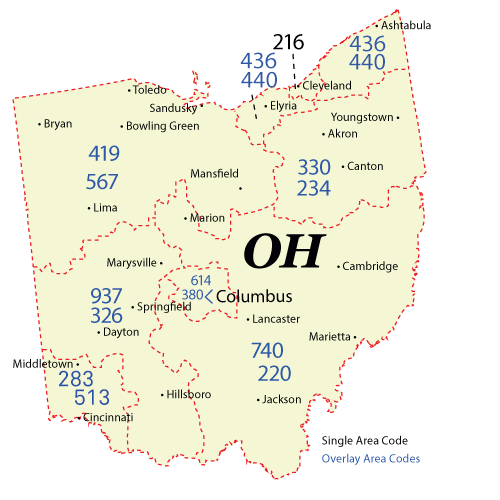
Rate Center: Eaton (EATON)
Phone numbers with the Eaton rate center prefixes:
Illinois City Phone Books
- Columbus, OH Phone Book
- Cleveland, OH Phone Book
- Cincinnati, OH Phone Book
- Toledo, OH Phone Book
- Akron, OH Phone Book
- Dayton, OH Phone Book
- Parma, OH Phone Book
- Canton, OH Phone Book
- Youngstown, OH Phone Book
- Lorain, OH Phone Book
- Hamilton, OH Phone Book
- Springfield, OH Phone Book
- Kettering, OH Phone Book
- Elyria, OH Phone Book
- Lakewood, OH Phone Book
- Newark, OH Phone Book
- Cuyahoga Falls, OH Phone Book
- Middletown, OH Phone Book
- Dublin, OH Phone Book
- Beavercreek, OH Phone Book
- Mentor, OH Phone Book
- Euclid, OH Phone Book
- Mansfield, OH Phone Book
- Strongsville, OH Phone Book
- Cleveland Heights, OH Phone Book
- Fairfield, OH Phone Book
- Delaware, OH Phone Book
- Grove City, OH Phone Book
- Findlay, OH Phone Book
- Huber Heights, OH Phone Book
- Westerville, OH Phone Book
- Lancaster, OH Phone Book
- Warren, OH Phone Book
- Reynoldsburg, OH Phone Book
- Hilliard, OH Phone Book
- Lima, OH Phone Book
- Marion, OH Phone Book
- Gahanna, OH Phone Book
- Upper Arlington, OH Phone Book
- Brunswick, OH Phone Book
- Stow, OH Phone Book
- North Ridgeville, OH Phone Book
- Mason, OH Phone Book
- Fairborn, OH Phone Book
- Massillon, OH Phone Book
- Westlake, OH Phone Book
- Bowling Green, OH Phone Book
- North Olmsted, OH Phone Book
- North Royalton, OH Phone Book
- Kent, OH Phone Book
- Austintown, OH Phone Book
- Garfield Heights, OH Phone Book
- Shaker Heights, OH Phone Book
- Xenia, OH Phone Book
- Wooster, OH Phone Book
- Troy, OH Phone Book
- Barberton, OH Phone Book
- Medina, OH Phone Book
- Zanesville, OH Phone Book
- Athens, OH Phone Book
- Sandusky, OH Phone Book
- Marysville, OH Phone Book
- Trotwood, OH Phone Book
- Avon Lake, OH Phone Book
- Wadsworth, OH Phone Book
- Centerville, OH Phone Book
- Avon, OH Phone Book
- Oxford, OH Phone Book
- Willoughby, OH Phone Book
- Solon, OH Phone Book
- Hudson, OH Phone Book
- Maple Heights, OH Phone Book
- Alliance, OH Phone Book
- Chillicothe, OH Phone Book
- Perrysburg, OH Phone Book
- Pickerington, OH Phone Book
- Piqua, OH Phone Book
- Lebanon, OH Phone Book
- Sidney, OH Phone Book
- Ashland, OH Phone Book
- Rocky River, OH Phone Book
- Portsmouth, OH Phone Book
- Miamisburg, OH Phone Book
- Oregon, OH Phone Book
- Painesville, OH Phone Book
- Sylvania, OH Phone Book
- Twinsburg, OH Phone Book
- Berea, OH Phone Book
- Niles, OH Phone Book
- Springboro, OH Phone Book
- Eastlake, OH Phone Book
- Ashtabula, OH Phone Book
- Steubenville, OH Phone Book
- New Philadelphia, OH Phone Book
- Tiffin, OH Phone Book
- North Canton, OH Phone Book
- East Cleveland, OH Phone Book
- Norwalk, OH Phone Book
- Defiance, OH Phone Book
- Mount Vernon, OH Phone Book
- Streetsboro, OH Phone Book
- Aurora, OH Phone Book
- Fremont, OH Phone Book
- Pataskala, OH Phone Book
- Middleburg Heights, OH Phone Book
- Bay Village, OH Phone Book
- Vandalia, OH Phone Book
- Worthington, OH Phone Book
- Sharonville, OH Phone Book
- Washington Court House, OH Phone Book
- Monroe, OH Phone Book
- Circleville, OH Phone Book
- Loveland, OH Phone Book
- Bexley, OH Phone Book
- Maumee, OH Phone Book
- Marietta, OH Phone Book
- Brecksville, OH Phone Book
- Englewood, OH Phone Book
- Powell, OH Phone Book
- Bellefontaine, OH Phone Book
- Fostoria, OH Phone Book
- Warrensville Heights, OH Phone Book
- Trenton, OH Phone Book
- West Carrollton, OH Phone Book
- Harrison, OH Phone Book
- Dover, OH Phone Book
- Greenville, OH Phone Book
- Wickliffe, OH Phone Book
- Bedford, OH Phone Book
- Conneaut, OH Phone Book
- Wilmington, OH Phone Book
- Blue Ash, OH Phone Book
- Amherst, OH Phone Book
- Macedonia, OH Phone Book
- Franklin, OH Phone Book
- Bucyrus, OH Phone Book
- Salem, OH Phone Book
- Beachwood, OH Phone Book
- Ravenna, OH Phone Book
- Urbana, OH Phone Book
- New Albany, OH Phone Book
- Coshocton, OH Phone Book
- Heath, OH Phone Book
- Ironton, OH Phone Book
- East Liverpool, OH Phone Book
- Vermilion, OH Phone Book
- Van Wert, OH Phone Book
- Celina, OH Phone Book
- Cambridge, OH Phone Book
- London, OH Phone Book
- Tipp City, OH Phone Book
- Galion, OH Phone Book
- Wapakoneta, OH Phone Book
- Girard, OH Phone Book
- Canal Winchester, OH Phone Book
- Kenton, OH Phone Book
- Napoleon, OH Phone Book
- Shelby, OH Phone Book
- Orrville, OH Phone Book
- Oberlin, OH Phone Book
- Bryan, OH Phone Book
- St. Marys, OH Phone Book
- Eaton, OH Phone Book
- Bellevue, OH Phone Book
- Wauseon, OH Phone Book
- Canfield, OH Phone Book
- Independence, OH Phone Book
- Delphos, OH Phone Book
- Uniontown, OH Phone Book
- Huron, OH Phone Book
- Milford, OH Phone Book
- Cortland, OH Phone Book
- Logan, OH Phone Book
- Upper Sandusky, OH Phone Book
- Rossford, OH Phone Book
- Hillsboro, OH Phone Book
- Columbiana, OH Phone Book
- Rittman, OH Phone Book
- Belpre, OH Phone Book
- Brookville, OH Phone Book
- Jackson, OH Phone Book
- Port Clinton, OH Phone Book
- Clyde, OH Phone Book
- Willard, OH Phone Book
- Grafton, OH Phone Book
- Geneva, OH Phone Book
- Sunbury, OH Phone Book
- Granville, OH Phone Book
- Groveport, OH Phone Book
- New Carlisle, OH Phone Book
- Ada, OH Phone Book
- Chardon, OH Phone Book
- Johnstown, OH Phone Book
- St. Clairsville, OH Phone Book
- Nelsonville, OH Phone Book
- Newton Falls, OH Phone Book
- Georgetown, OH Phone Book
- Crestline, OH Phone Book
- Blanchester, OH Phone Book
- Archbold, OH Phone Book
- Ottawa, OH Phone Book
- Waverly, OH Phone Book
- Greenfield, OH Phone Book
- Newcomerstown, OH Phone Book
- Bluffton, OH Phone Book
- Yellow Springs, OH Phone Book
- Montpelier, OH Phone Book
- Chagrin Falls, OH Phone Book
- Plain City, OH Phone Book
- Richfield, OH Phone Book
- Mogadore, OH Phone Book
- Northfield, OH Phone Book
- Barnesville, OH Phone Book
- Gallipolis, OH Phone Book
- Jefferson, OH Phone Book
- Carrollton, OH Phone Book
- Millersburg, OH Phone Book
- Cadiz, OH Phone Book
- Madison, OH Phone Book
- Waynesville, OH Phone Book
- South Point, OH Phone Book
- Versailles, OH Phone Book
- Middlefield, OH Phone Book
- New Richmond, OH Phone Book
- Lisbon, OH Phone Book
- New Concord, OH Phone Book
- Arcanum, OH Phone Book
- Poland, OH Phone Book
- Hebron, OH Phone Book
- Gambier, OH Phone Book
- Batavia, OH Phone Book
- Caldwell, OH Phone Book
- Sugarcreek, OH Phone Book
- Piketon, OH Phone Book
- Genoa, OH Phone Book
- Lucasville, OH Phone Book
- Bellville, OH Phone Book
- Pomeroy, OH Phone Book
- Holland, OH Phone Book
- West Liberty, OH Phone Book
- Milan, OH Phone Book
- Burton, OH Phone Book
- Smithville, OH Phone Book
- Peninsula, OH Phone Book
- Proctorville, OH Phone Book
- Carroll, OH Phone Book
- Raymond, OH Phone Book
- Liberty Township, OH Phone Book
- Lewis Center, OH Phone Book
- Boardman, OH Phone Book
- Copley, OH Phone Book
- West Chester, OH Phone Book
Local Time in Eaton, OH
Local Time
04:20 AM
Date
Thursday, April 25, 2024
Time Zone
EDT
Eaton, OH Population
Chicago has a population of 8154 people. Sex ratio is 85.50 males per 100 females.
Population by Age
The median age in Chicago is 34.8 years.
| Age Groups | Population |
|---|---|
| Under 5 years | 270 |
| 5 to 9 years | 549 |
| 10 to 14 years | 578 |
| 15 to 19 years | 450 |
| 20 to 24 years | 288 |
| 25 to 29 years | 394 |
| 30 to 34 years | 470 |
| 35 to 39 years | 527 |
| 40 to 44 years | 477 |
| 45 to 49 years | 394 |
| 50 to 54 years | 438 |
| 55 to 59 years | 1012 |
| 60 to 64 years | 414 |
| 65 to 69 years | 568 |
| 70 to 74 years | 562 |
| 75 to 79 years | 250 |
| 80 to 84 years | 227 |
| 85 years and over | 286 |
Race & Ethnicity
| Racial/Ethnic Groups | Percent |
|---|---|
| White | 7774 |
| Black or African American | 74 |
| American Indian and Alaska Native | 15 |
| Native Hawaiian and Other Pacific Islander | 0 |
| Some Other Race | 53 |
| Two or more races | 381 |