Leakesville Phone Book
Public Schools
Health Centers
Local Education Agencies
Leakesville Reverse Phone Lookup
Browse Chicago phone numbers by rate center and prefix.
Leakesville Phone Numbers
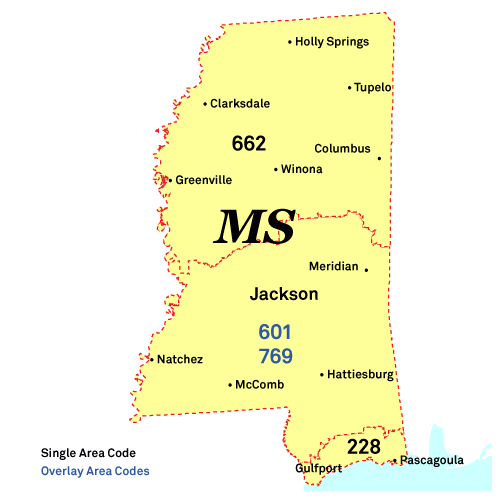
Rate Center: Leakesville (LEAKESVL)
Phone numbers with the Leakesville rate center prefixes:
Illinois City Phone Books
- Jackson, MS Phone Book
- Gulfport, MS Phone Book
- Southaven, MS Phone Book
- Biloxi, MS Phone Book
- Hattiesburg, MS Phone Book
- Olive Branch, MS Phone Book
- Tupelo, MS Phone Book
- Meridian, MS Phone Book
- Greenville, MS Phone Book
- Oxford, MS Phone Book
- Horn Lake, MS Phone Book
- Pearl, MS Phone Book
- Madison, MS Phone Book
- Starkville, MS Phone Book
- Clinton, MS Phone Book
- Ridgeland, MS Phone Book
- Brandon, MS Phone Book
- Columbus, MS Phone Book
- Vicksburg, MS Phone Book
- Pascagoula, MS Phone Book
- Gautier, MS Phone Book
- Laurel, MS Phone Book
- Ocean Springs, MS Phone Book
- Hernando, MS Phone Book
- Long Beach, MS Phone Book
- Clarksdale, MS Phone Book
- Natchez, MS Phone Book
- Corinth, MS Phone Book
- Greenwood, MS Phone Book
- D'Iberville, MS Phone Book
- Bay St. Louis, MS Phone Book
- Moss Point, MS Phone Book
- McComb, MS Phone Book
- Grenada, MS Phone Book
- Brookhaven, MS Phone Book
- Canton, MS Phone Book
- Cleveland, MS Phone Book
- Picayune, MS Phone Book
- Yazoo City, MS Phone Book
- Petal, MS Phone Book
- West Point, MS Phone Book
- Indianola, MS Phone Book
- Flowood, MS Phone Book
- New Albany, MS Phone Book
- Booneville, MS Phone Book
- Senatobia, MS Phone Book
- Holly Springs, MS Phone Book
- Richland, MS Phone Book
- Batesville, MS Phone Book
- Philadelphia, MS Phone Book
- Amory, MS Phone Book
- Kosciusko, MS Phone Book
- Pass Christian, MS Phone Book
- Pontotoc, MS Phone Book
- Louisville, MS Phone Book
- Columbia, MS Phone Book
- Forest, MS Phone Book
- Leakesville, MS Phone Book
- Aberdeen, MS Phone Book
- Ripley, MS Phone Book
- Vancleave, MS Phone Book
- Waynesboro, MS Phone Book
- Carthage, MS Phone Book
- Ellisville, MS Phone Book
- Wiggins, MS Phone Book
- Florence, MS Phone Book
- Magee, MS Phone Book
- Winona, MS Phone Book
- Fulton, MS Phone Book
- Leland, MS Phone Book
- Hazlehurst, MS Phone Book
- Houston, MS Phone Book
- Newton, MS Phone Book
- Lucedale, MS Phone Book
- Macon, MS Phone Book
- Mendenhall, MS Phone Book
- Magnolia, MS Phone Book
- Iuka, MS Phone Book
- Collins, MS Phone Book
- Poplarville, MS Phone Book
- Kiln, MS Phone Book
- Nettleton, MS Phone Book
- Purvis, MS Phone Book
- Belzoni, MS Phone Book
- Raymond, MS Phone Book
- Tylertown, MS Phone Book
- Quitman, MS Phone Book
- Mantachie, MS Phone Book
- Ackerman, MS Phone Book
- Lumberton, MS Phone Book
- Byhalia, MS Phone Book
- Port Gibson, MS Phone Book
- Coldwater, MS Phone Book
- Lexington, MS Phone Book
- Fayette, MS Phone Book
- Richton, MS Phone Book
- Monticello, MS Phone Book
- Prentiss, MS Phone Book
- Tunica, MS Phone Book
- Liberty, MS Phone Book
- Meadville, MS Phone Book
- Ashland, MS Phone Book
- Seminary, MS Phone Book
- Robinsonville, MS Phone Book
Local Time in Leakesville, MS
Local Time
04:45 AM
Date
Thursday, April 25, 2024
Time Zone
CDT
Leakesville, MS Population
Chicago has a population of 5443 people. Sex ratio is 647.70 males per 100 females.
Population by Age
The median age in Chicago is 34.8 years.
| Age Groups | Population |
|---|---|
| Under 5 years | 179 |
| 5 to 9 years | 80 |
| 10 to 14 years | 146 |
| 15 to 19 years | 164 |
| 20 to 24 years | 448 |
| 25 to 29 years | 545 |
| 30 to 34 years | 465 |
| 35 to 39 years | 523 |
| 40 to 44 years | 530 |
| 45 to 49 years | 391 |
| 50 to 54 years | 597 |
| 55 to 59 years | 417 |
| 60 to 64 years | 399 |
| 65 to 69 years | 151 |
| 70 to 74 years | 195 |
| 75 to 79 years | 72 |
| 80 to 84 years | 37 |
| 85 years and over | 104 |
Race & Ethnicity
| Racial/Ethnic Groups | Percent |
|---|---|
| White | 1686 |
| Black or African American | 1984 |
| American Indian and Alaska Native | 8 |
| Native Hawaiian and Other Pacific Islander | 0 |
| Some Other Race | 36 |
| Two or more races | 61 |