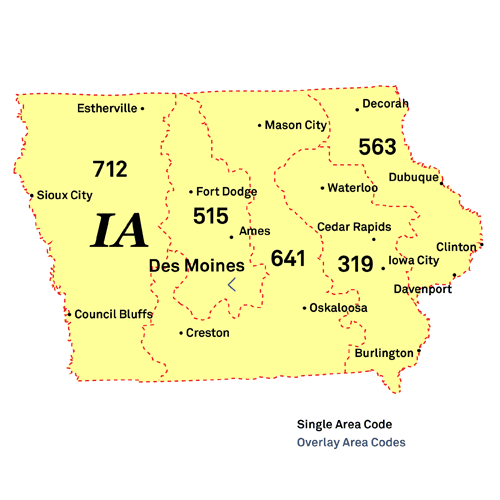
North Liberty Phone Book
Public Schools
Alternative Fuel Stations
North Liberty Reverse Phone Lookup
Browse Chicago phone numbers by rate center and prefix.
North Liberty Phone Numbers
Rate Center: North Liberty (NO LIBERTY)
Phone numbers with the North Liberty rate center prefixes:
Illinois City Phone Books
- Des Moines, IA Phone Book
- Cedar Rapids, IA Phone Book
- Davenport, IA Phone Book
- Sioux City, IA Phone Book
- Iowa City, IA Phone Book
- Waterloo, IA Phone Book
- West Des Moines, IA Phone Book
- Ames, IA Phone Book
- Ankeny, IA Phone Book
- Council Bluffs, IA Phone Book
- Dubuque, IA Phone Book
- Urbandale, IA Phone Book
- Cedar Falls, IA Phone Book
- Marion, IA Phone Book
- Bettendorf, IA Phone Book
- Mason City, IA Phone Book
- Marshalltown, IA Phone Book
- Clinton, IA Phone Book
- Burlington, IA Phone Book
- Ottumwa, IA Phone Book
- Fort Dodge, IA Phone Book
- Muscatine, IA Phone Book
- Waukee, IA Phone Book
- Johnston, IA Phone Book
- Coralville, IA Phone Book
- North Liberty, IA Phone Book
- Altoona, IA Phone Book
- Clive, IA Phone Book
- Indianola, IA Phone Book
- Newton, IA Phone Book
- Grimes, IA Phone Book
- Boone, IA Phone Book
- Oskaloosa, IA Phone Book
- Norwalk, IA Phone Book
- Spencer, IA Phone Book
- Storm Lake, IA Phone Book
- Fort Madison, IA Phone Book
- Fairfield, IA Phone Book
- Pella, IA Phone Book
- Keokuk, IA Phone Book
- Waverly, IA Phone Book
- Le Mars, IA Phone Book
- Pleasant Hill, IA Phone Book
- Carroll, IA Phone Book
- Grinnell, IA Phone Book
- Mount Pleasant, IA Phone Book
- Denison, IA Phone Book
- Creston, IA Phone Book
- Webster City, IA Phone Book
- Perry, IA Phone Book
- Decorah, IA Phone Book
- Clear Lake, IA Phone Book
- Sioux Center, IA Phone Book
- Charles City, IA Phone Book
- Washington, IA Phone Book
- Knoxville, IA Phone Book
- Nevada, IA Phone Book
- Eldridge, IA Phone Book
- Atlantic, IA Phone Book
- Orange City, IA Phone Book
- Independence, IA Phone Book
- Maquoketa, IA Phone Book
- Oelwein, IA Phone Book
- Estherville, IA Phone Book
- Anamosa, IA Phone Book
- Centerville, IA Phone Book
- Algona, IA Phone Book
- Clarinda, IA Phone Book
- Red Oak, IA Phone Book
- Winterset, IA Phone Book
- Sheldon, IA Phone Book
- Osceola, IA Phone Book
- Spirit Lake, IA Phone Book
- Vinton, IA Phone Book
- Iowa Falls, IA Phone Book
- Manchester, IA Phone Book
- Adel, IA Phone Book
- Sergeant Bluff, IA Phone Book
- Cherokee, IA Phone Book
- Shenandoah, IA Phone Book
- Harlan, IA Phone Book
- Humboldt, IA Phone Book
- Hampton, IA Phone Book
- Dyersville, IA Phone Book
- Chariton, IA Phone Book
- Jefferson, IA Phone Book
- Forest City, IA Phone Book
- Rock Valley, IA Phone Book
- Carter Lake, IA Phone Book
- Cresco, IA Phone Book
- Albia, IA Phone Book
- Emmetsburg, IA Phone Book
- Waukon, IA Phone Book
- Osage, IA Phone Book
- New Hampton, IA Phone Book
- Story City, IA Phone Book
- Tipton, IA Phone Book
- Williamsburg, IA Phone Book
- West Burlington, IA Phone Book
- Clarion, IA Phone Book
- Bloomfield, IA Phone Book
- Grundy Center, IA Phone Book
- West Union, IA Phone Book
- Missouri Valley, IA Phone Book
- Sibley, IA Phone Book
- Madrid, IA Phone Book
- Rock Rapids, IA Phone Book
- Postville, IA Phone Book
- West Branch, IA Phone Book
- Lamoni, IA Phone Book
- Northwood, IA Phone Book
- Ida Grove, IA Phone Book
- Sigourney, IA Phone Book
- Colfax, IA Phone Book
- Leon, IA Phone Book
- Walcott, IA Phone Book
- Guttenberg, IA Phone Book
- Corning, IA Phone Book
- Corydon, IA Phone Book
- Fairbank, IA Phone Book
- Avoca, IA Phone Book
- Eldon, IA Phone Book
Local Time in North Liberty, IA
Local Time
11:44 PM
Date
Wednesday, April 24, 2024
Time Zone
CDT
North Liberty, IA Population
Chicago has a population of 19159 people. Sex ratio is 89.30 males per 100 females.
Population by Age
The median age in Chicago is 34.8 years.
| Age Groups | Population |
|---|---|
| Under 5 years | 2113 |
| 5 to 9 years | 2030 |
| 10 to 14 years | 1512 |
| 15 to 19 years | 650 |
| 20 to 24 years | 1323 |
| 25 to 29 years | 1334 |
| 30 to 34 years | 2535 |
| 35 to 39 years | 1731 |
| 40 to 44 years | 1845 |
| 45 to 49 years | 1174 |
| 50 to 54 years | 683 |
| 55 to 59 years | 488 |
| 60 to 64 years | 582 |
| 65 to 69 years | 406 |
| 70 to 74 years | 204 |
| 75 to 79 years | 154 |
| 80 to 84 years | 215 |
| 85 years and over | 180 |
Race & Ethnicity
| Racial/Ethnic Groups | Percent |
|---|---|
| White | 16616 |
| Black or African American | 1324 |
| American Indian and Alaska Native | 38 |
| Native Hawaiian and Other Pacific Islander | 13 |
| Some Other Race | 427 |
| Two or more races | 1446 |
