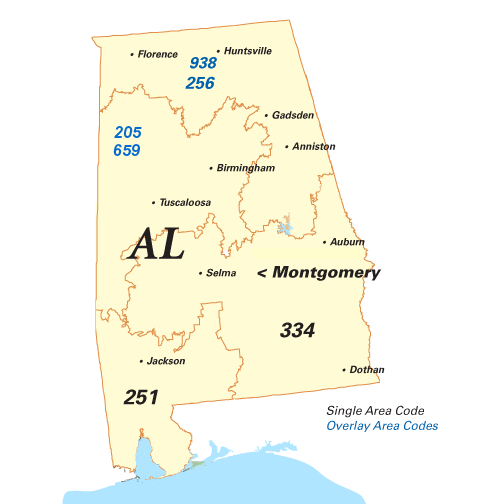
Centreville Phone Book
Public Schools
Libraries
Health Centers
Cahaba Medical Care - Training Center
155 Birmingham Rd Ste 110, Centreville, AL 35042-2949
Cahaba Medical Care - Centreville Administrative Office
281 Alexander Ave, Centreville, AL 35042-2953
Cahaba Medical Care - Centreville Dental Office
260 Walnut St, Centreville, AL 35042-2332
Fire Departments
Centreville Reverse Phone Lookup
Browse Chicago phone numbers by rate center and prefix.
Centreville Phone Numbers
Rate Center: Centreville (CENTREVL)
Phone numbers with the Centreville rate center prefixes:
Illinois City Phone Books
- Birmingham, AL Phone Book
- Huntsville, AL Phone Book
- Montgomery, AL Phone Book
- Mobile, AL Phone Book
- Tuscaloosa, AL Phone Book
- Hoover, AL Phone Book
- Dothan, AL Phone Book
- Auburn, AL Phone Book
- Decatur, AL Phone Book
- Madison, AL Phone Book
- Florence, AL Phone Book
- Prattville, AL Phone Book
- Phenix City, AL Phone Book
- Gadsden, AL Phone Book
- Vestavia Hills, AL Phone Book
- Alabaster, AL Phone Book
- Opelika, AL Phone Book
- Enterprise, AL Phone Book
- Athens, AL Phone Book
- Daphne, AL Phone Book
- Bessemer, AL Phone Book
- Northport, AL Phone Book
- Homewood, AL Phone Book
- Pelham, AL Phone Book
- Trussville, AL Phone Book
- Fairhope, AL Phone Book
- Albertville, AL Phone Book
- Anniston, AL Phone Book
- Oxford, AL Phone Book
- Foley, AL Phone Book
- Troy, AL Phone Book
- Selma, AL Phone Book
- Cullman, AL Phone Book
- Millbrook, AL Phone Book
- Talladega, AL Phone Book
- Saraland, AL Phone Book
- Alexander City, AL Phone Book
- Scottsboro, AL Phone Book
- Hartselle, AL Phone Book
- Muscle Shoals, AL Phone Book
- Ozark, AL Phone Book
- Calera, AL Phone Book
- Pell City, AL Phone Book
- Fort Payne, AL Phone Book
- Gardendale, AL Phone Book
- Jasper, AL Phone Book
- Jacksonville, AL Phone Book
- Leeds, AL Phone Book
- Gulf Shores, AL Phone Book
- Sylacauga, AL Phone Book
- Eufaula, AL Phone Book
- Fairfield, AL Phone Book
- Russellville, AL Phone Book
- Boaz, AL Phone Book
- Bay Minette, AL Phone Book
- Atmore, AL Phone Book
- Fultondale, AL Phone Book
- Valley, AL Phone Book
- Spanish Fort, AL Phone Book
- Sheffield, AL Phone Book
- Clanton, AL Phone Book
- Andalusia, AL Phone Book
- Guntersville, AL Phone Book
- Tuscumbia, AL Phone Book
- Tuskegee, AL Phone Book
- Arab, AL Phone Book
- Wetumpka, AL Phone Book
- Greenville, AL Phone Book
- Montevallo, AL Phone Book
- Robertsdale, AL Phone Book
- Demopolis, AL Phone Book
- Hamilton, AL Phone Book
- Oneonta, AL Phone Book
- Opp, AL Phone Book
- Lanett, AL Phone Book
- Orange Beach, AL Phone Book
- Roanoke, AL Phone Book
- Attalla, AL Phone Book
- Monroeville, AL Phone Book
- Fort Rucker, AL Phone Book
- Brewton, AL Phone Book
- Jackson, AL Phone Book
- Columbiana, AL Phone Book
- Piedmont, AL Phone Book
- Springville, AL Phone Book
- Fayette, AL Phone Book
- Geneva, AL Phone Book
- Haleyville, AL Phone Book
- Thomasville, AL Phone Book
- Evergreen, AL Phone Book
- Centre, AL Phone Book
- Union Springs, AL Phone Book
- Heflin, AL Phone Book
- Hanceville, AL Phone Book
- Livingston, AL Phone Book
- Moulton, AL Phone Book
- Marion, AL Phone Book
- Dadeville, AL Phone Book
- Greensboro, AL Phone Book
- Eutaw, AL Phone Book
- Centreville, AL Phone Book
- Ashville, AL Phone Book
- Camden, AL Phone Book
- Grove Hill, AL Phone Book
- Chatom, AL Phone Book
- Wedowee, AL Phone Book
- Hope Hull, AL Phone Book
- Irvington, AL Phone Book
- Lafayette, AL Phone Book
Local Time in Centreville, AL
Local Time
03:05 PM
Date
Friday, April 19, 2024
Time Zone
CDT
Centreville, AL Population
Chicago has a population of 2627 people. Sex ratio is 92.00 males per 100 females.
Population by Age
The median age in Chicago is 34.8 years.
| Age Groups | Population |
|---|---|
| Under 5 years | 95 |
| 5 to 9 years | 142 |
| 10 to 14 years | 86 |
| 15 to 19 years | 262 |
| 20 to 24 years | 32 |
| 25 to 29 years | 351 |
| 30 to 34 years | 75 |
| 35 to 39 years | 121 |
| 40 to 44 years | 102 |
| 45 to 49 years | 141 |
| 50 to 54 years | 128 |
| 55 to 59 years | 173 |
| 60 to 64 years | 307 |
| 65 to 69 years | 259 |
| 70 to 74 years | 119 |
| 75 to 79 years | 100 |
| 80 to 84 years | 102 |
| 85 years and over | 32 |
Race & Ethnicity
| Racial/Ethnic Groups | Percent |
|---|---|
| White | 1944 |
| Black or African American | 685 |
| American Indian and Alaska Native | 10 |
| Native Hawaiian and Other Pacific Islander | 0 |
| Some Other Race | 72 |
| Two or more races | 82 |
